> For the complete documentation index, see [llms.txt](https://docs.chartprime.com/llms.txt). Markdown versions of documentation pages are available by appending `.md` to page URLs; this page is available as [Markdown](https://docs.chartprime.com/chartprime-plus/market-oracle+.md).
# Market Oracle+
Market Oracle+ builds upon Market Oracle, offering more customizability and powerful tools all in a single toolkit. The following pages outline the added features and how to maximize their use. If you are looking for documentation regarding other core Market Oracle features, you can do so [here](/market-oracle/the-oracle-pro.md).
## Prophecy Signals
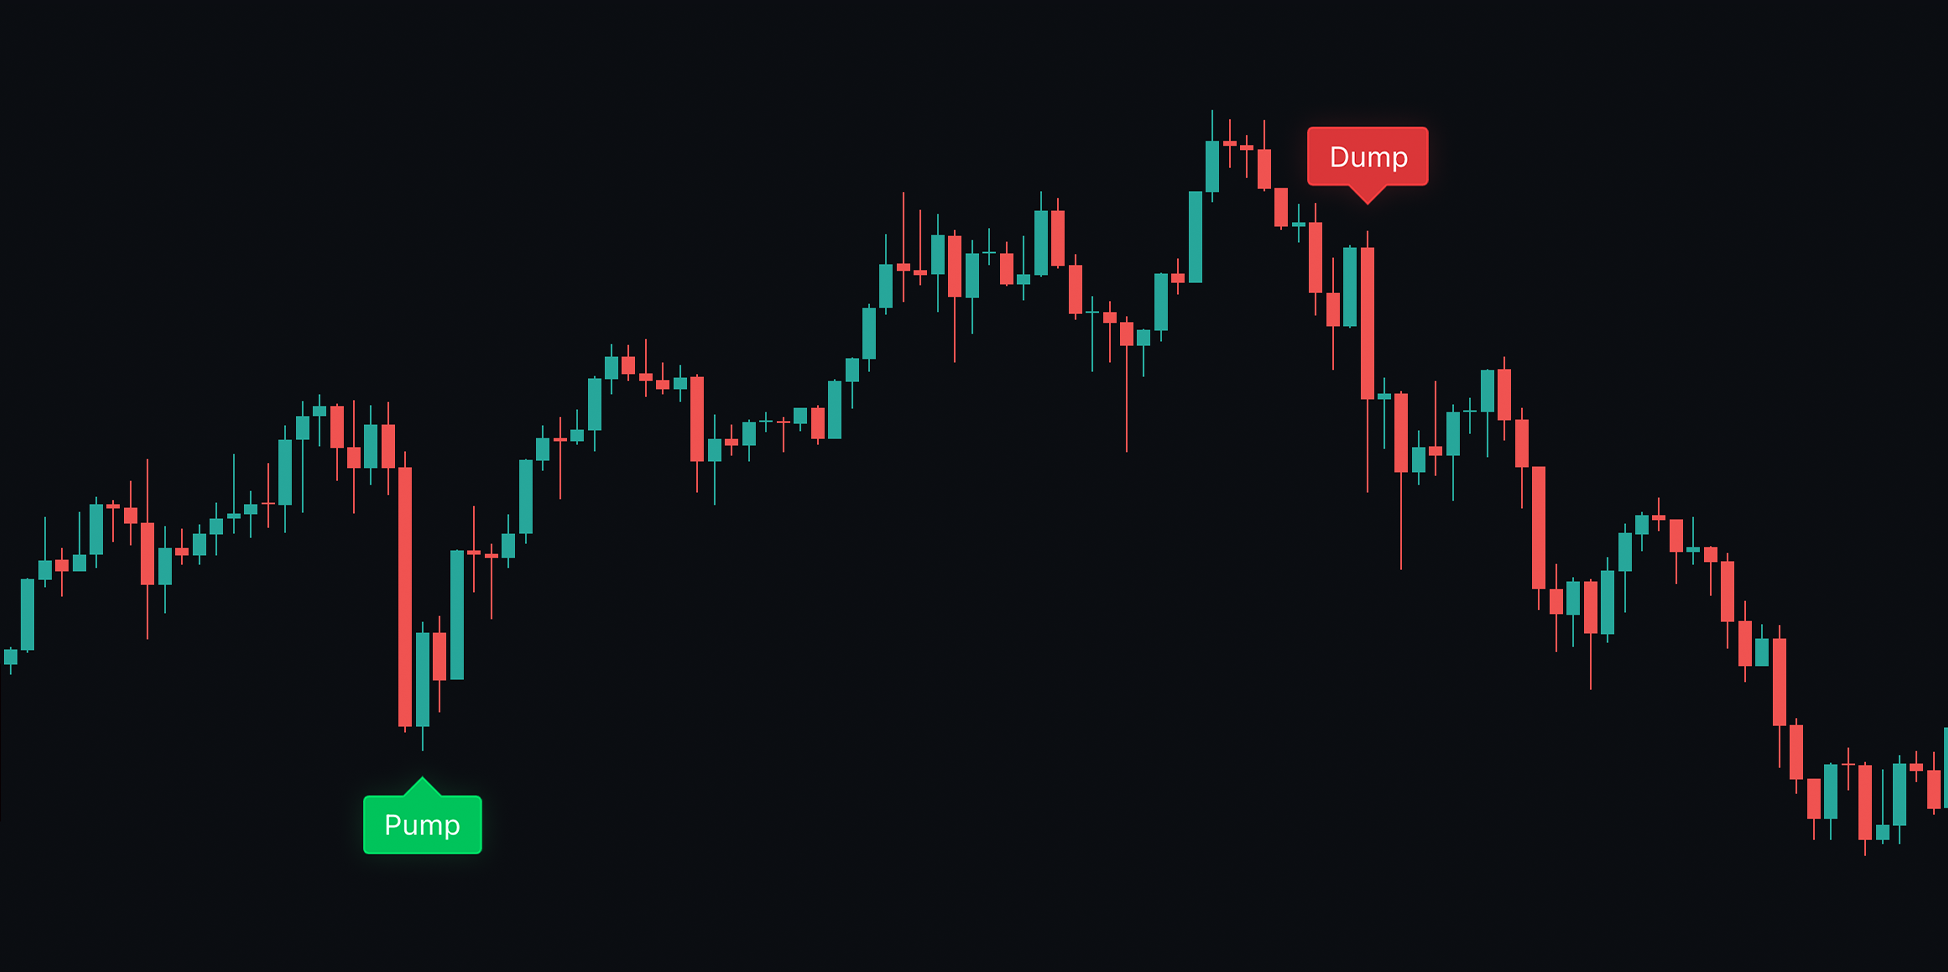
The cutting-edge Prophecy Signals have been added to Market Oracle Plus. These aren’t classical signals based on trends. Instead, they aim to give traders true insights into market behavior and direction. These signals can be used to independently identify shifting market sentiment and serve as strong confluence points. They are less likely to be thrown off by market noise or give false signals.
*Predicting true dumps and pumps*
See the overview video:
{% embed url="" %}
Via the settings users can also enable Max Profit and Take Profit labels with the signals. These indicate the optimal areas in the market to exit using the Prophecy algorithm as an underlying calculation.
## Custom Signals
Toolkits and signals often limit traders to a single algorithm, reducing flexibility and adaptability. Market Oracle+ includes a custom signals builder, allowing users to combine various toolkit components into a personalized signal or alert. For example, you can create a signal that triggers when a trend shift aligns with bullish candlestick patterns. Traders can also create alerts based on these custom signals to help automate trading workflows.
{% hint style="info" %}
To use the Custom Signals, please ensure signals are enabled at the top of your settings.
{% endhint %}
See the overview video:
{% embed url="" %}
The first two dropdowns specify the conditions that must be met to trigger an alert. The final input sets the lookback period for the conditions. For example, if you want an alert when a buy signal and a bullish candlestick appear within five bars of each other, set the lookback to 5 and the alert will trigger accordingly.
 *Plus labels denote a triggered signal*
## Quantum Bands
Quantum Bands identify zones with a high probability of price reversals by analyzing market momentum and noise. When the price enters one of these zones, a reversal becomes more likely. Quantum Bands are especially effective when paired with other reversal indicators.
{% embed url="" %}
What sets these bands apart is their adaptability to trending markets, enabling identification of reversals in both ranging and trending markets by leveraging volatility calculations.
 *Bounces off the bands*
Users can also use Multi-Time Frame (MTF) functionality to load bands from higher timeframes, offering a broader view of support and resistance levels. This is useful for scalpers who trade at the extremes of the bands for early entries and exits.
## Quantum Reactor
The Quantum Reactor is a market balance indicator designed to help filter out fake pumps and dumps. It turns gray during higher-risk market conditions to avoid false signals and unprofitable trades. Unlike traditional moving averages that constantly try to adapt to trends, the Reactor selectively filters them out for a more refined trend analysis.
{% embed url="" %}
Using the Quantum Reactor to detect and filter out fake pumps and dumps helps identify genuine breakouts versus bull or bear traps, which can safeguard portfolios and trades.
The Reactor features two modes, fast and slow, adjustable in settings:
* Fast mode: reacts quickly to price action — suitable for short-term scalpers.
* Slow mode: more stable, less prone to noise — better for long-term traders.
 *Quantum Reactor filtering a pump*
***
### VWAP Channels
The VWAP Channels found within Market Oracle Pro Plus focus on revealing key market volume levels in the market. By taking the famous VWAP, we transform it into two usable sets of bands. The lower in green and the upper in purple. A dashed line is produced at each band giving the user a region of space the price is most likely to reverse from.
Price bouncing from the VWAP Bands
When price has a confirmed retest and bounce a triangle is produced acting as a reversal signal. Notice in the image above, our price comes to the upper band and sees a clear reaction. These are perfect short position entries.
Triangles (VWAP Reversal SIgnals) are produced when the reversal is confirmed adding to trader's confidence.
These bands are real time and do not repaint and provide excellent targets and entries for both scalpers and swing traders.\
\
Users can also enable the warning section via the settings which warns the user when the VWAP bands are about to reset. These bands take into account set time periods and reset themselves to adjust to the market. Having the warning enabled means traders have a headstart in knowing how relevant the bands are.
***
### Volatility Matrix
The Volatility Matrix is a simple but powerful tool that detects high volatility candles and market pressure. By looking for candles with these identifiers traders can know and have a clear indication of a large market push or pressure.
Volatility Matrix indicating pressure
In the example above we can see the market was in a clear uptrend. The presence of a Volatility Matrix firing indicates that the market has signficant push behind it and therefore we can add to our position. Users are able to adjust the threshold for their detection in the settings with higher values resulting in fewer, tighter detections.