> For the complete documentation index, see [llms.txt](https://docs.chartprime.com/llms.txt). Markdown versions of documentation pages are available by appending `.md` to page URLs; this page is available as [Markdown](https://docs.chartprime.com/market-dynamics/pattern-detection.md).
# Pattern Detection
#### Pattern Detection
The ChartPrime pattern detection tool offers unique insights into pattern structures, targets, and breakouts.
Users can select which patterns they want displayed and identified on their charts. Available patterns include:
* Wedges
* Triangles
* Channels
* Swing Fail
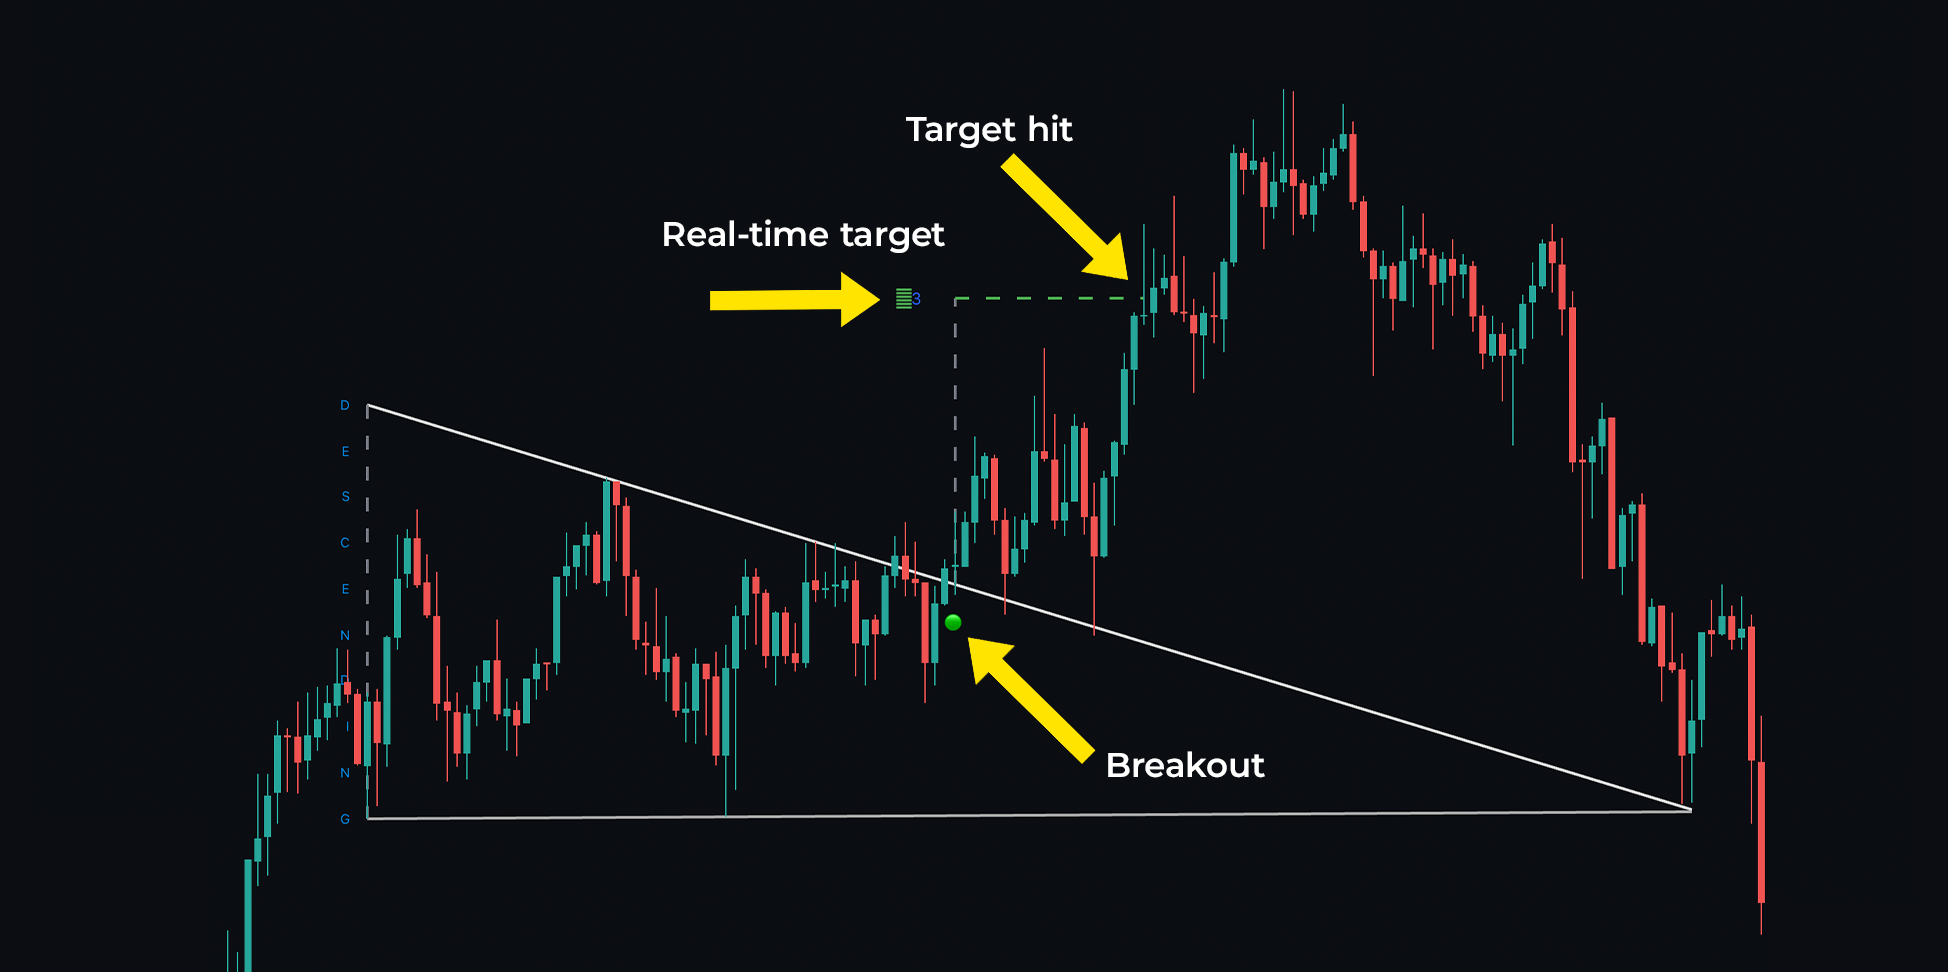
Once a pattern is identified, traders will see its name labeled vertically, along with a dot indicating the breakout point, as shown below:
Pattern breakout with real-time targets
#### Settings
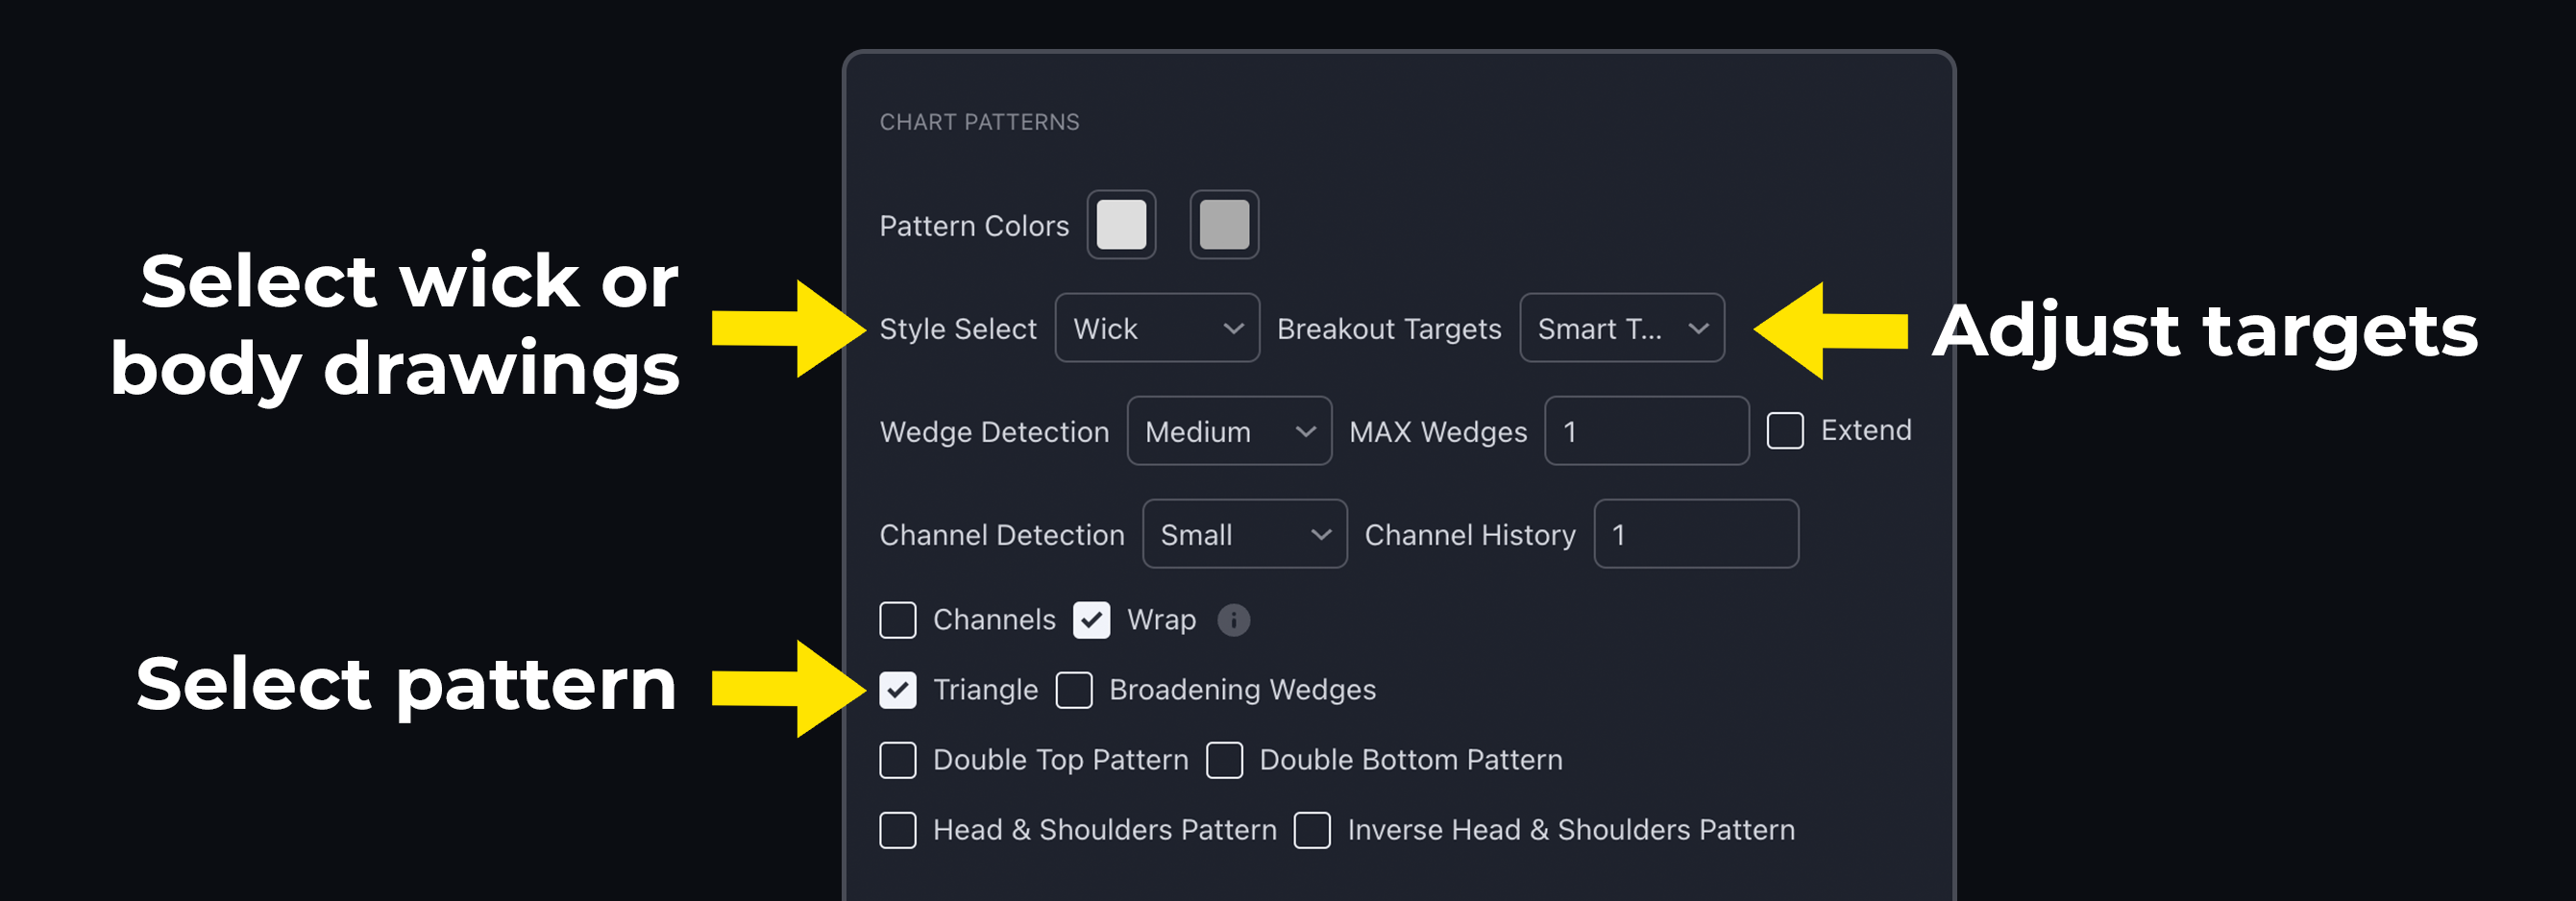
Traders can customize the number of historical patterns visible on their charts through the maximum wedges input. The wedge detection dropdown allows traders to specify the scale of the patterns identified. For example, selecting “small” will display short-term patterns, while “macro” will analyze a larger number of bars to show larger patterns.
Settings provided for pattern customization
#### Extend
Traders can enable an extend mode to forecast the pattern’s support and resistance levels, which serves as potential future targets.
**Targets**
The targets can be derived using classical measurement rules or our smart targets based on volatility. This feature provides actionable insights and targets for traders to aim for. Traders can also display historical patterns and customize colors through the settings.
{% hint style="warning" %}
Targets for patterns are not guaranteed. ChartPrime calculates them based on analysis, but it doesn’t ensure they will be hit.
{% endhint %}
**Breaks**
The channels in Market Dynamics also indicate breaks, with labels that include:
* LV: Low Volume
* MV: Medium Volume
* HV: High Volume
* AAL: Above Average Length — an extension of the channel indicates an imminent breakout.
Traders can customize how a pattern is drawn, choosing to base patterns on either the wicks of candles or the bodies. The buffer zone option allows patterns to be represented as zonal plots, providing reasonable areas of abnormal price activity before a pattern is considered broken.
To learn how to maximize the potential of pattern detection, watch the video below:
{% embed url="" %}
#### Pattern Definitions
{% stepper %}
{% step %}
### Wedges
Description: A wedge pattern is characterized by converging trendlines that slope either upward (rising wedge) or downward (falling wedge). It signals a potential trend reversal or continuation.
{% endstep %}
{% step %}
### Triangles
Description: Triangles are formed by connecting a series of highs and lows with trendlines, creating a triangular shape. Common types include ascending, descending, and symmetrical triangles, which suggest potential breakouts or breakdowns.
{% endstep %}
{% step %}
### Channels
Description: Channel patterns consist of parallel trendlines drawn along the highs and lows of an asset’s price movements. Channels can be ascending (uptrend), descending (downtrend), or horizontal (sideways), indicating a defined price range for the asset.
{% endstep %}
{% step %}
### Swing Fail
Description: This pattern occurs when an asset attempts to break through a significant support or resistance level but fails to maintain the breakout, often leading to a reversal in the opposite direction. Traders monitor swing fails as they can indicate shifts in market sentiment.
{% endstep %}
{% endstepper %}
{% hint style="info" %}
Patterns are not guaranteed structures. It’s important to use confluence when trading them.
{% endhint %}