> For the complete documentation index, see [llms.txt](https://docs.chartprime.com/llms.txt). Markdown versions of documentation pages are available by appending `.md` to page URLs; this page is available as [Markdown](https://docs.chartprime.com/market-dynamics/profiles-and-liquidity.md).
# Profiles & Liquidity
Market Dynamics Pro includes several liquidity tools.\
Use them to map likely reaction zones and confirm who’s in control.
### Quick index
* Prime Blocks
* Liquidity Zones
* Volume Profile
* Premium & Discount Zones
* Fair Value Gaps (FVGs)
### Prime Blocks
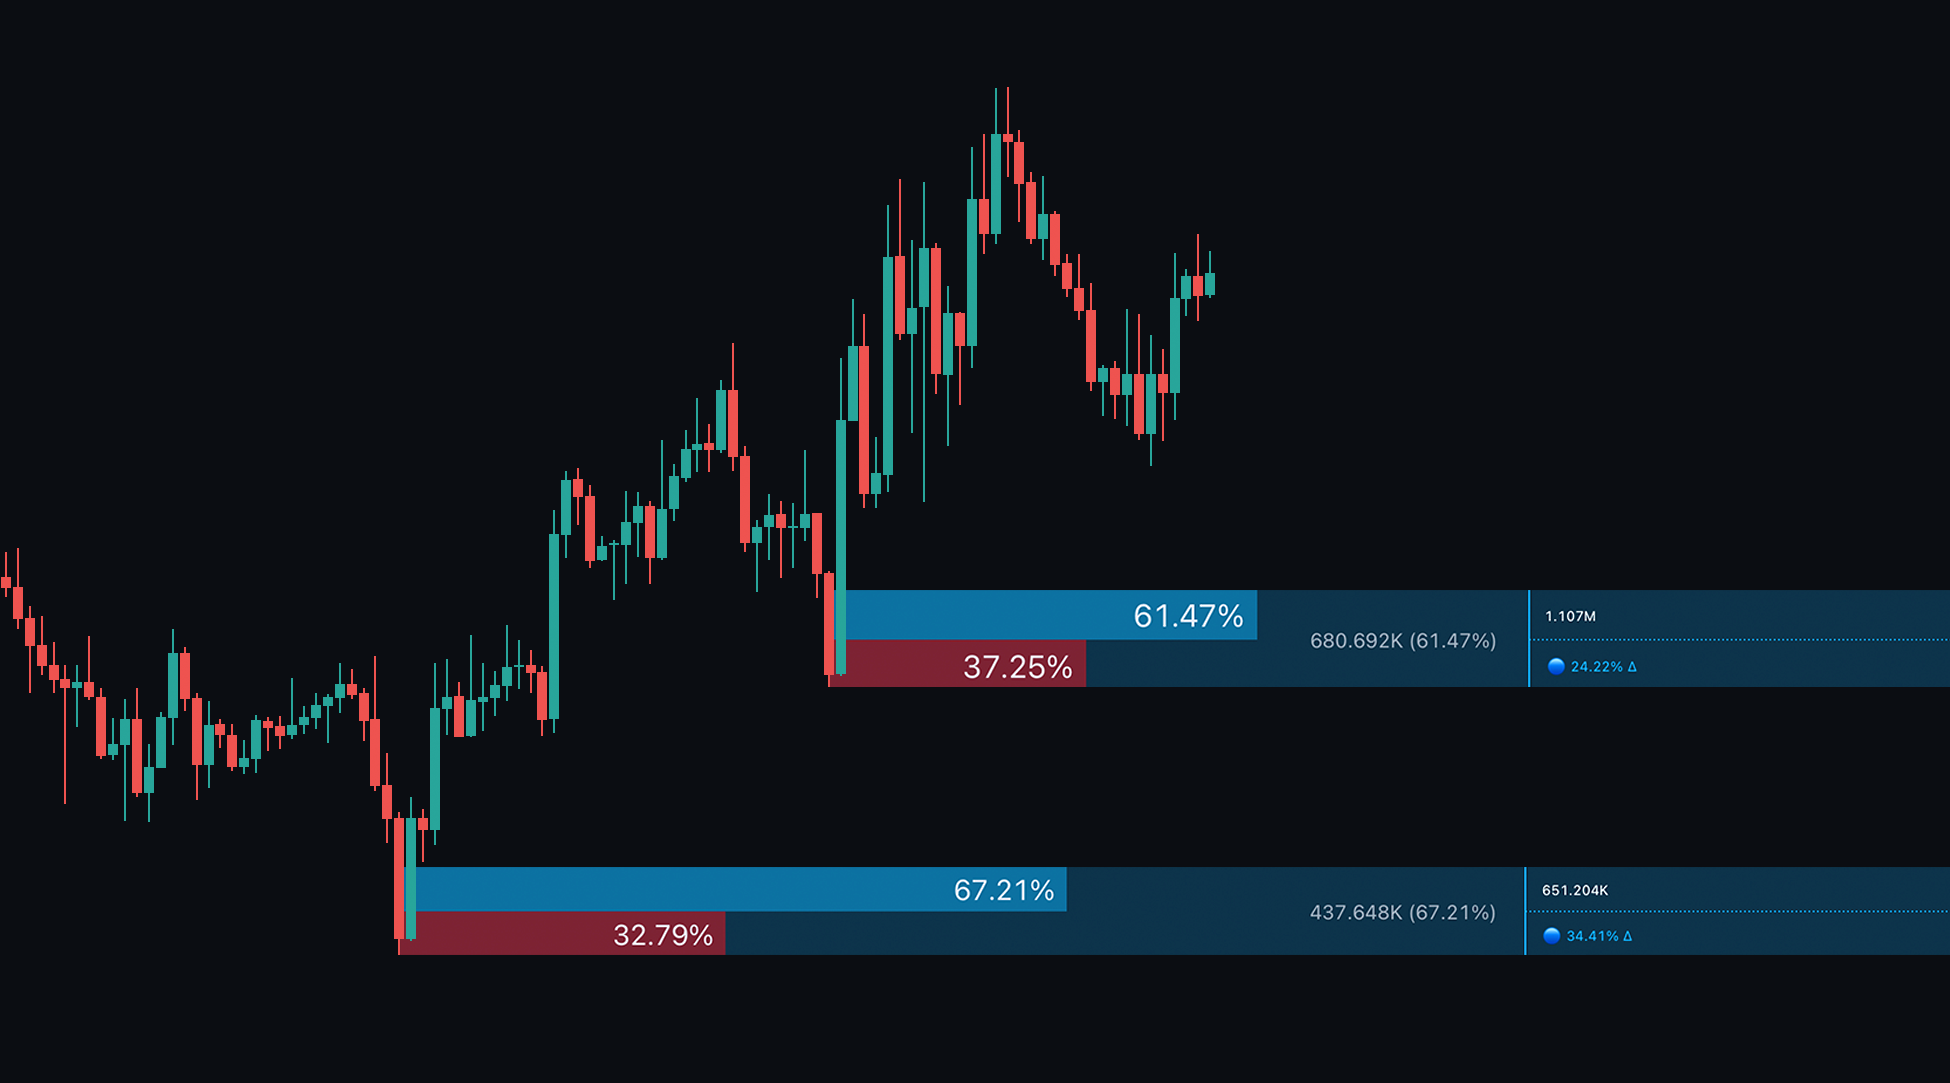
Prime Blocks highlight liquidity created around major structure shifts.\
Use them to spot bounce and reversal candidates.
#### What the block shows
* **Bull vs bear volume %** inside the block.\
This is buying vs selling pressure in that region.
* **Gray text**: volume for the block’s side only.
* Bearish block: bear volume as % of total OB volume.
* Bullish block: bull volume as % of total OB volume.
#### Delta (who’s winning)
**Δ (delta)** is the difference between buyer and seller volume.\
It’s a fast read on control inside that zone.
Prime Blocks
The delta circle uses these ranges:
* **Red**: strong negative delta (**-100% → -20%**).
* **Yellow**: neutral delta (**-10% → 10%**).
* **Blue**: strong positive delta (**20% → 100%**).
#### Common tuning
* Reduce **block count** to declutter.
* Choose zone source: **wicks** vs **bodies**.
{% embed url="" %}
***
### Liquidity Zones
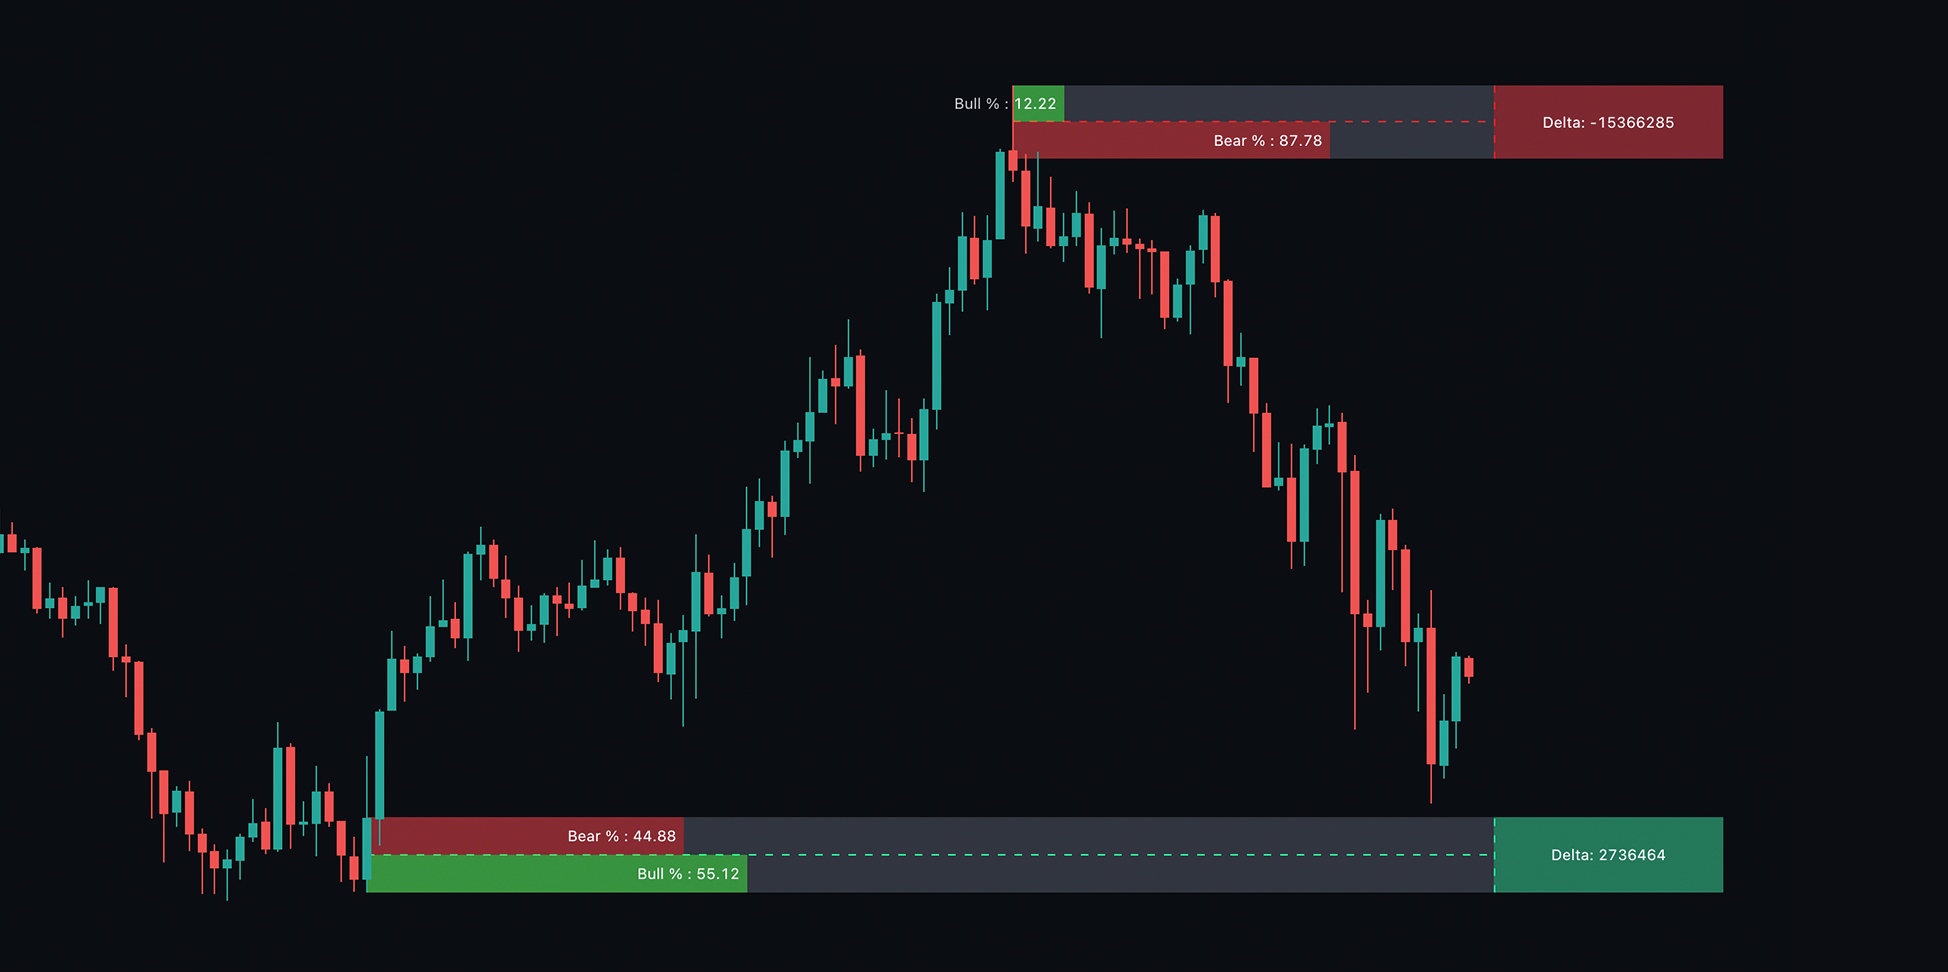
Liquidity Zones mark price levels that likely contain stacked orders.\
They include a bull/bear split plus delta, so you can judge bias. By analysing the difference in buying and selling activity users can gain insights into market dynamics and mentality.
Liquidity Zones
#### How traders use them
* **TP / SL references**.
* **Support / resistance** levels.
* Zone location matters:
* Above price: **sell-side** liquidity.
* Below price: **buy-side** liquidity.
{% embed url="" %}
Via the settings users have two inputs. The first value represents the lookback on the zones. This means a higher value will focus on highlighting longer term zones - a shorter value will focus on a smaller, more recent zone.
Users are also able to adjust the maximum zones shown on the chart.
***
### Volume Profile
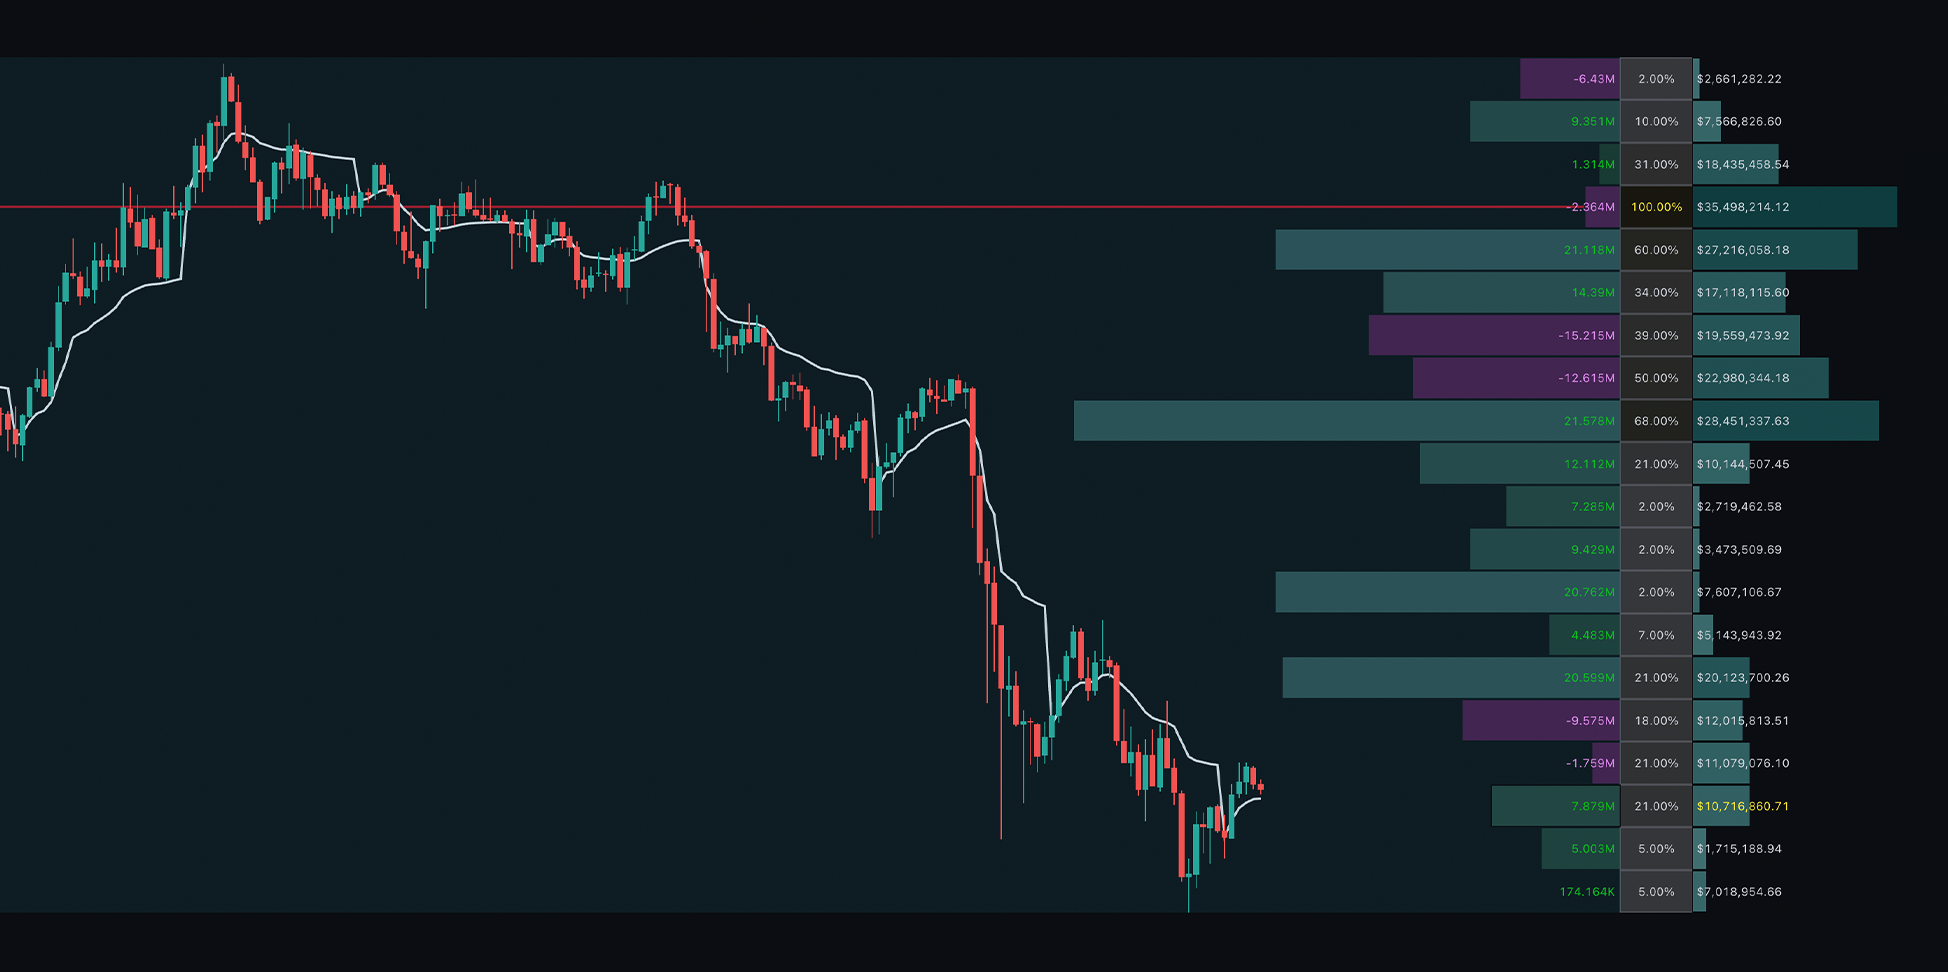
ChartPrime’s Volume Profile maps where trading actually happened.\
Use it to find high-liquidity nodes and likely SR zones.
#### What you see
* **Left**: base volume.
* **Right**: quote value.
* **Center %**: strength rating for that level.
* A bounding box shows the **scanned window** (length + depth).
#### POC types
You can switch the Point of Control (POC) to different “most important” levels:
* **Delta +**: highest bull-minus-bear difference.
* **Delta -**: largest sell-side volume area.
* **Money Flow**: strongest in/out flow area.
* **Volume +**: highest total volume area.
* **Level %**: highest-rated level by the profile.
Changing POC moves the center marker to what you care about most.\
That makes the profile faster to read in real time.
Volume Profile
{% hint style="info" %}
Tip: Enable **Money Flow POC** and disable the full profile.\
You’ll get one clean zone showing major activity.
{% endhint %}
#### How to interpret it
* **Volume peaks** often act as stronger support/resistance.
* **Low-volume zones** can trade like “no man’s land”.\
Price may move fast and ignore minor levels there.
{% embed url="" %}
#### Optional VWAP
The Volume Profile settings include a **VWAP toggle**.\
It uses the profile search window as the VWAP range.
VWAP can help define trend and act as dynamic SR.
***
### Premium & Discount Zones
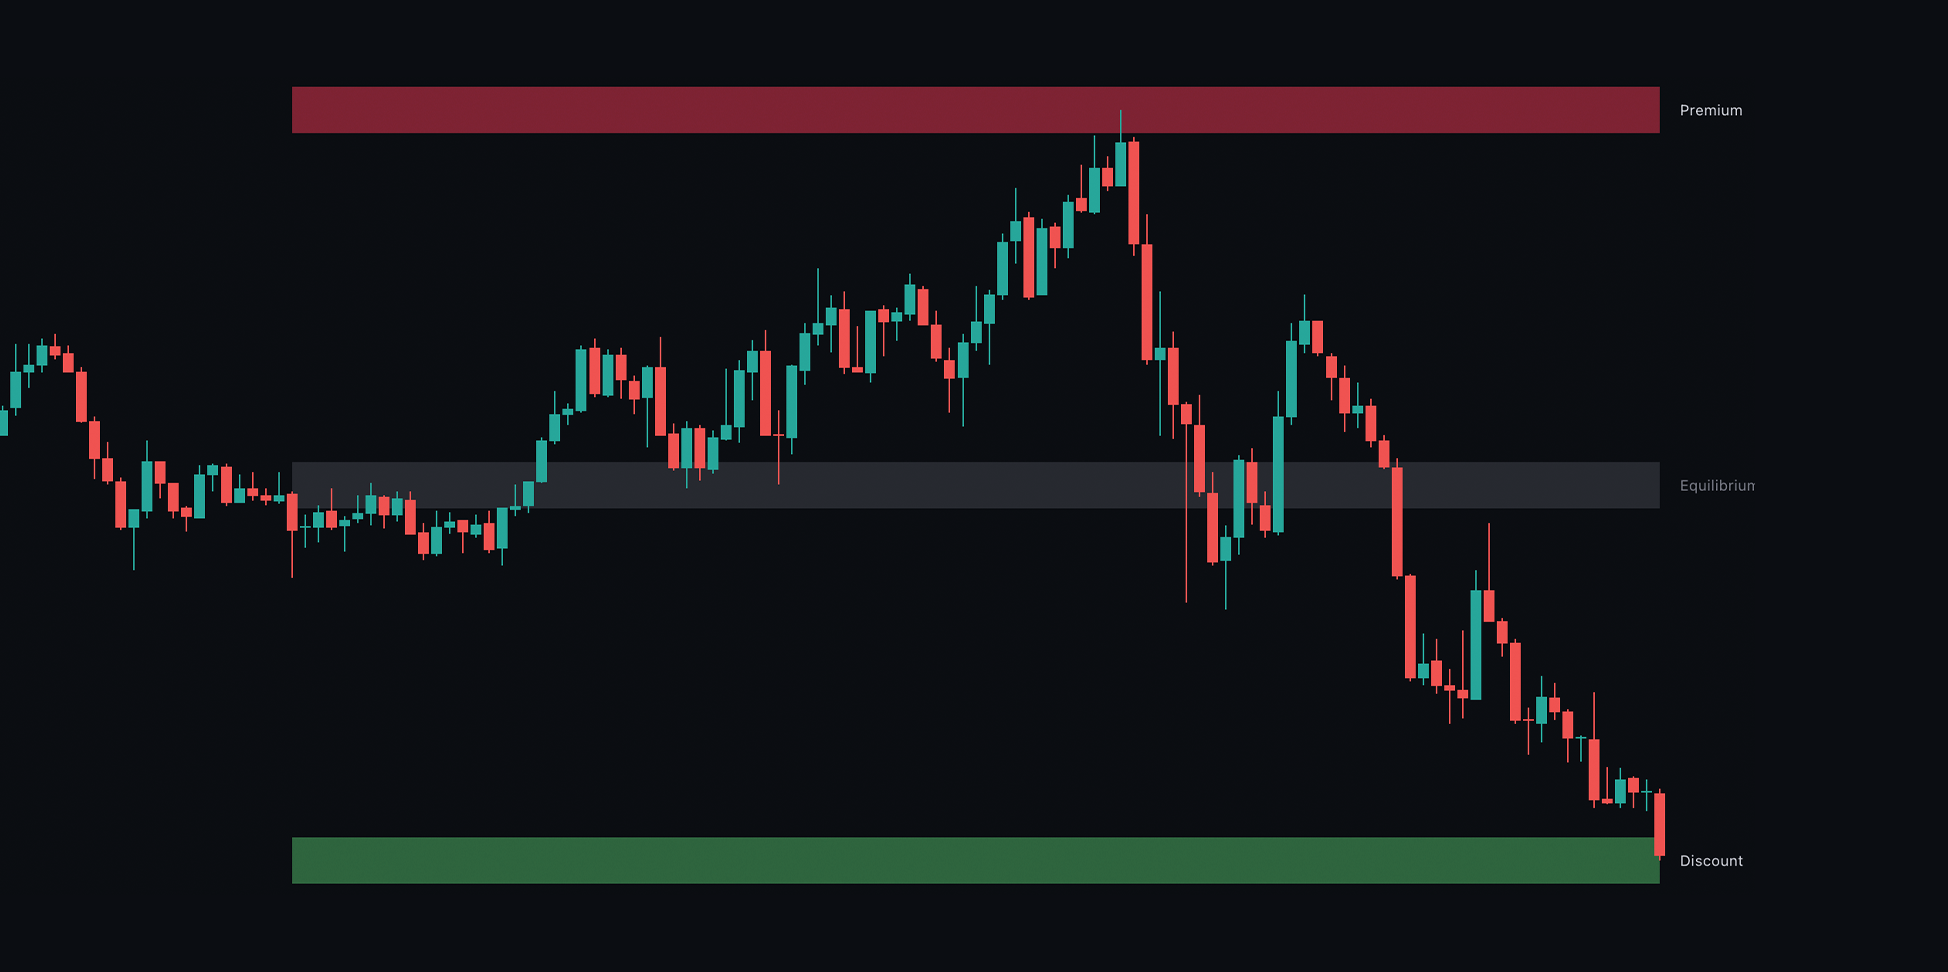
Premium/Discount Zones frame swing liquidity with a simple 3-band model.
#### The three zones
* **Discount (bottom)**: “cheap” area. Often used as a buy zone.
* **Equilibrium (middle)**: fair value / balance zone.
* **Premium (top)**: “expensive” area. Often used as a sell zone.
Premium and Discount Zones
#### Settings
* **Length**
* Higher = more bars, more macro zones.
* Lower = fewer bars, more reactive zones.
* **Colors** are fully configurable.
{% embed url="" %}
***
### Fair Value Gaps (FVGs)
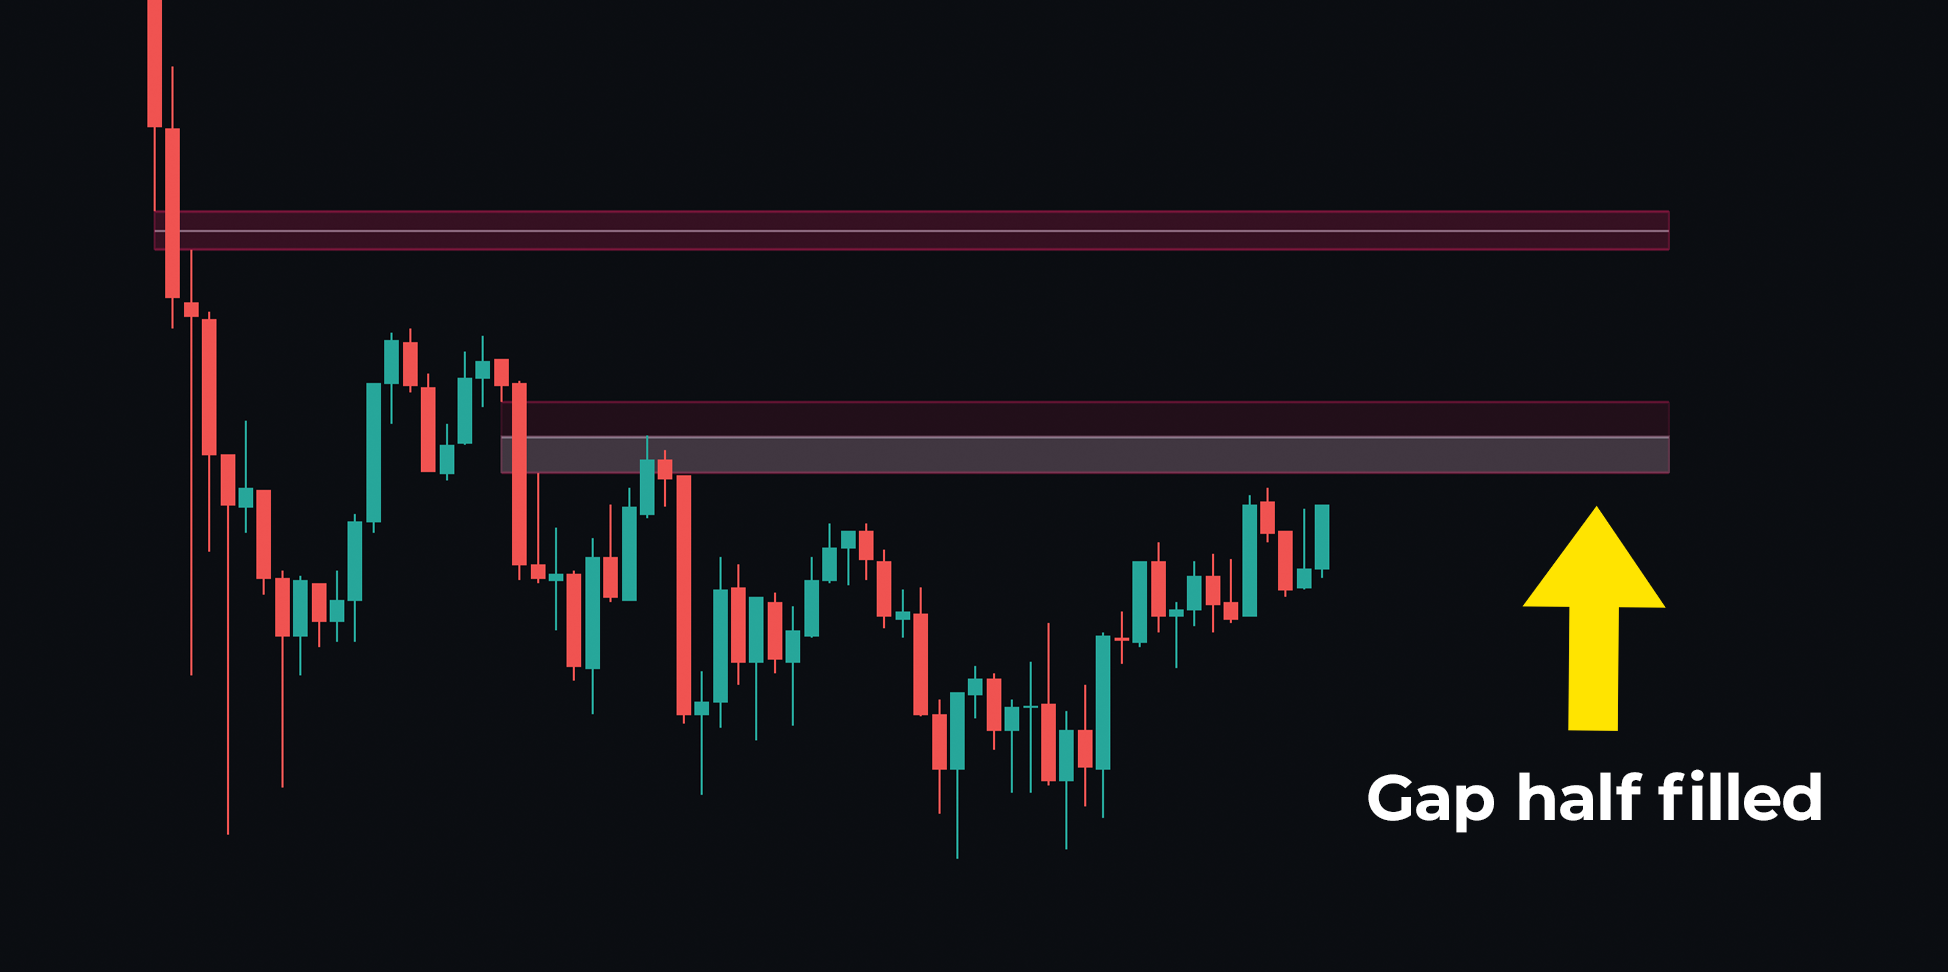
Fair Value Gaps (FVGs) are imbalance zones.\
They form when the prior and following candle don’t overlap in the middle.
Many traders treat FVGs as “magnets”.\
Once price fills the gap, balance is considered restored.
Fair Value Gaps
#### Key features
* Pull FVGs from other timeframes via the **timeframe dropdown**.
* **Extend** the zone for real-time planning.
* Many use FVGs as **TP targets** since price often revisits them.
#### Fill visualization
The **fill** shrinks the zone as price trades into it.\
That makes the “remaining” gap obvious.
{% embed url="" %}
#### FVG settings and setup
The FVG tool comes with various settings to enhance their functionality.
* **Show Last** - this option allows the user to display the last X FVGs on their chart.
* **TimeFrame** - this option allows users to display FVGs from various other timeframes on their chart.
* **Imbalance Volume** - this option allows the user to see the difference in volume that's occured within the FVG
* **Imbalance POC** - this option allows the modication of the POC shown with the FVG. Within the FVGs users can see a line that highlights the height of activity within the gap. This is normally using the middle of the block as a base however the highest and volume and lowest can also be highlighted making amazing entries or exits.
* **FVG Type** - bullish and bearish blocks can be specified.
* **FVG Threshold -** this option allows FVGs to be filtered out by strength. A higher value (up to 5) will make a powerful filter whereas a lower value will display more minor gaps.
* **Extension -** this allows the gaps to be extended X number of bars.