> For the complete documentation index, see [llms.txt](https://docs.chartprime.com/llms.txt). Markdown versions of documentation pages are available by appending `.md` to page URLs; this page is available as [Markdown](https://docs.chartprime.com/market-oracle/optimizing-your-signals.md).
# Optimizing Your Signals
As previously mentioned on the Trend Signals page, there are two main approaches to optimizing your signals:
{% stepper %}
{% step %}
### Optimal Tuning
The "Optimal Tuning" feature, accessible in the settings menu (located at the bottom right of the screen), provides users with a way to refine their trading approach. This tool offers a set of backtested settings that have historically yielded the best outcomes for a particular asset.
* Advantage: Consistency — allows traders to implement a stable and repeatable strategy.
* Drawback: Reduced adaptability to rapid market changes, since the algorithm operates on a fixed set of parameters.
{% endstep %}
{% step %}
### Auto Optimizer
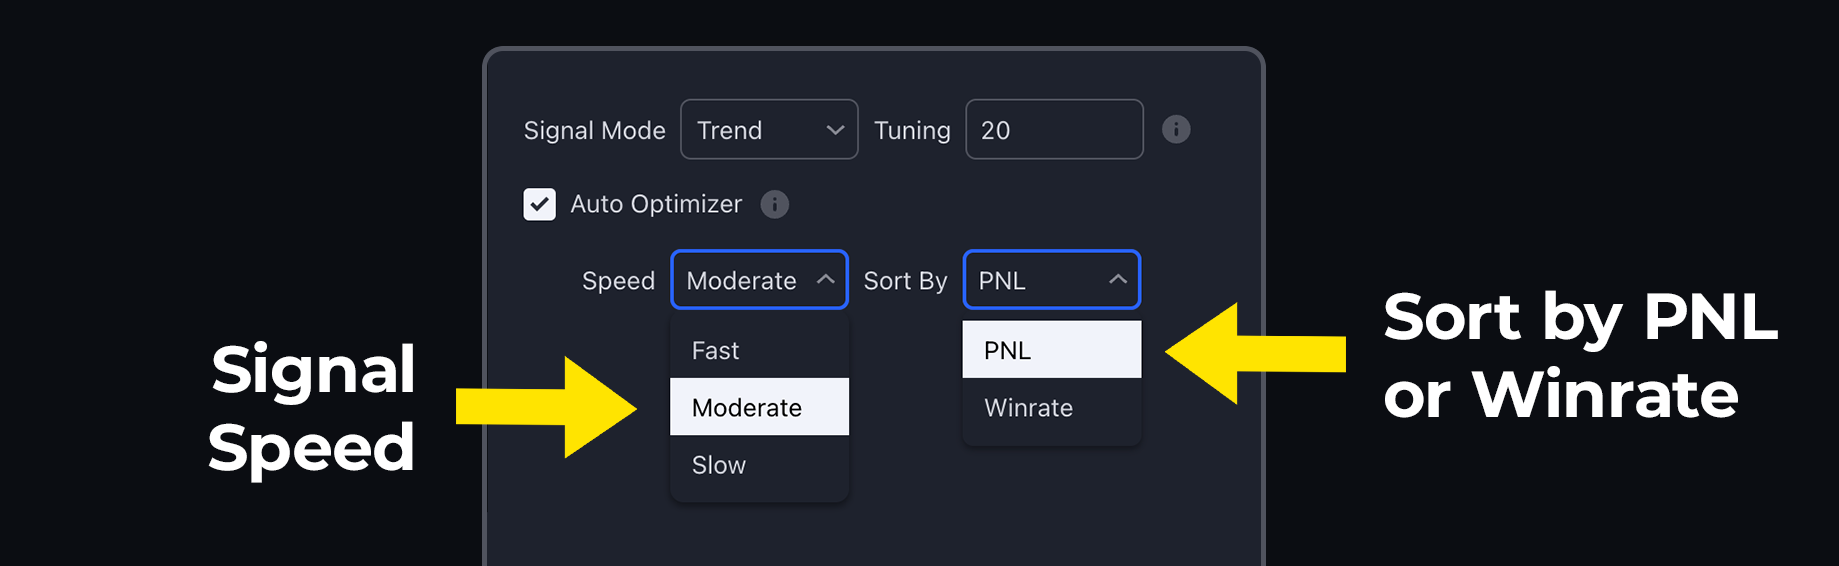
The "Auto Optimizer" offers a more fluid and adaptable optimization strategy. When activated, this feature allows the signal generation algorithm to automatically adjust its parameters in response to market conditions (trending or ranging).
* Users can control the frequency of adjustments (low to high).
* High frequency → more frequent trading signals (for more active traders).
* Low frequency → fewer signals (for more conservative or longer-term strategies).
* Users can also choose what to optimize for: win rate or profit and loss.
{% endstep %}
{% endstepper %}
Optimization options displayed
When using the Auto Optimizer, users can select the speed of adjustments (fast vs. slow) to match their desired behavior (e.g., scalping vs. longer-term). You can also adjust whether the optimizer focuses on win rate or profit and loss to tailor optimization to your goals.
{% hint style="info" %}
High win rates do not equal high profits.
A high win rate can still produce net losses if losing trades are much larger than winning trades (for example, winning $1 in many trades but losing $20 in one trade). Be mindful of this classic trap.
{% endhint %}
Ultimately, the choice between these two optimization methods depends on the trader's preferences and style. It's recommended to experiment with both techniques to determine which aligns best with your trading objectives before settling on a specific approach. Users may also choose not to optimize and simply select a setting they prefer to use when in confluence.
Alternatively, the ChartPrime Auto Maximizer will automatically apply a backtested parameter and display the "best performing signals" on your chart. You can choose between high frequency and low frequency signals here:
* High frequency → more frequent signals.
* Low frequency → fewer signals that emphasize larger market moves.
It's important to remember that no matter how optimized signals may be, they will never guarantee profits. Avoid "tail chasing" behaviors in search of perfect settings. The tool aims to achieve the best possible configurations to assist traders, but using optimized signals as part of a larger system and strategy is always the best approach.
See more detail below:
{% embed url="" %}