Prime Oscillator
This oscillator features a main ribbon, where red indicates a downtrend and green signals an uptrend. It also includes several other key components, outlined below:
Main Ribbon
The main ribbon is a straightforward yet powerful tool for gauging market sentiment and momentum. The ribbon ranges between 0 and 100: values above 50 indicate a bullish market (uptrend or increasing buying pressure), while values below 50 suggest a bearish market (downtrend or increasing selling pressure).
 |
|---|
| The Main Wave on the Prime Oscillator |
A key feature is the color-coding system, designed to enhance readability. Green represents a bullish market, and red indicates a bearish market.
By focusing on market momentum, the ribbon helps traders assess the strength and sustainability of current trends. Confluence is a critical aspect: when the ribbon’s position (above or below 50) aligns with its color (green or red), it provides a stronger signal of market direction.
Traders can use this indicator to identify potential entry and exit points, confirm trends, or as part of a broader trading strategy. Its simplicity, combined with the depth of information it provides, makes it a versatile tool across various trading styles and market conditions.
Reversal Signals
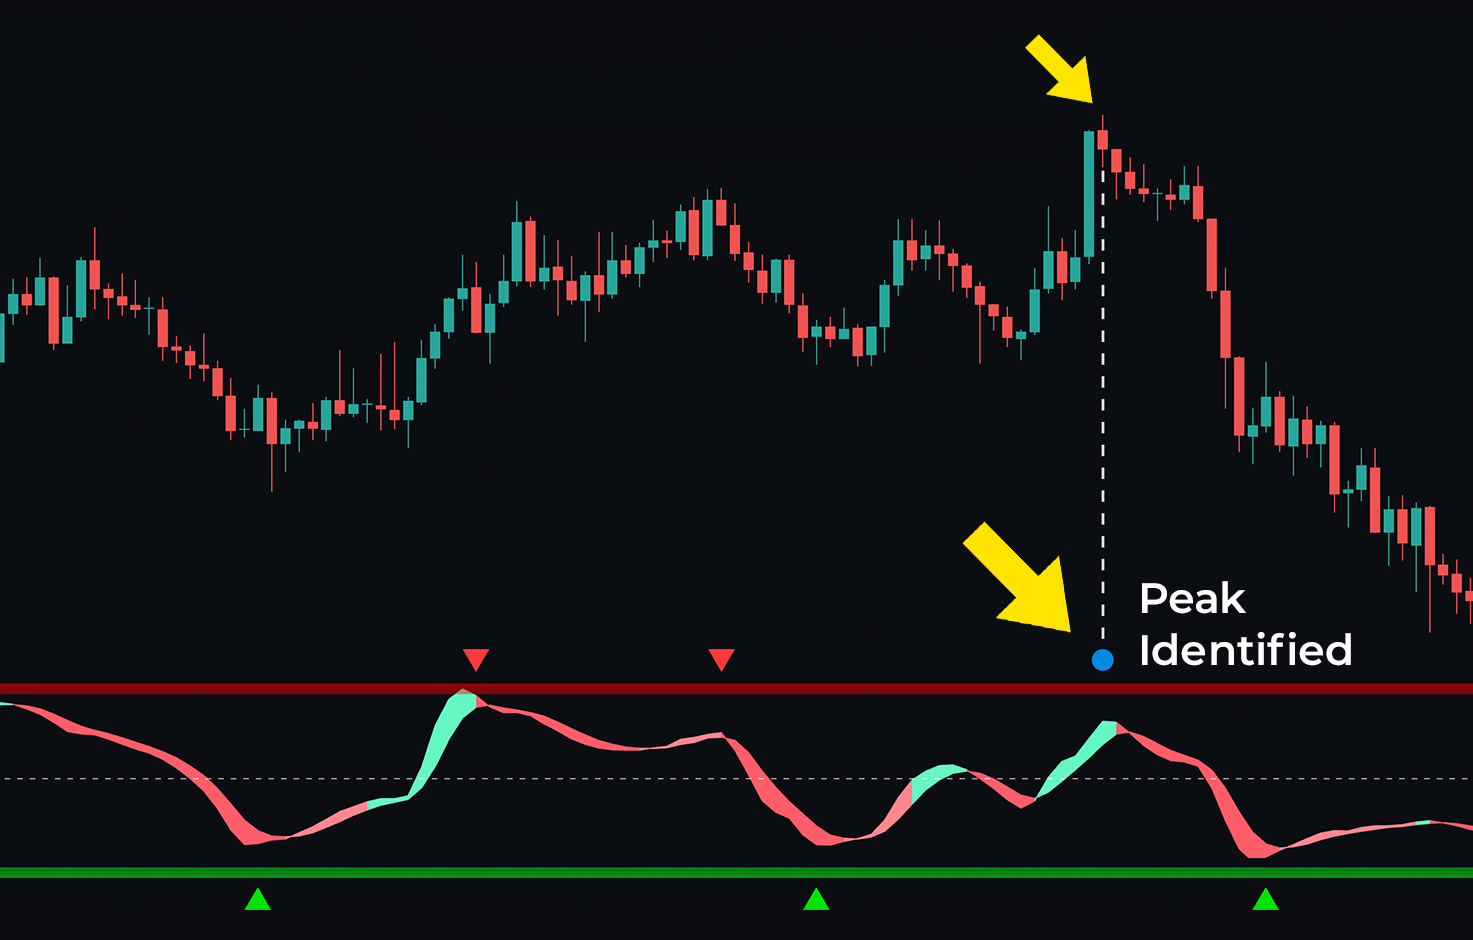
Reversal signals act as contrarian indicators, forecasting potential changes in market direction. “Peak seekers,” marked by blue dots, integrate data from multiple indicators to enhance accuracy in identifying divergences. These settings automatically adjust to the selected timeframe.
 |
|---|
| The Peak Seeker signals |
The “momentum ribbon” evaluates market volatility and signals potential trend shifts. A twist in this ribbon often indicates an impending market reversal.
This system is also designed to efficiently detect divergences, ensuring a wide range of potential market reversals are captured. This feature is especially useful for traders as it helps minimize the risk of missing key reversal signals.
Use confluence when trading reversals. These peak seeker dots are best used as part of a wider analysis system
OBOS Zones
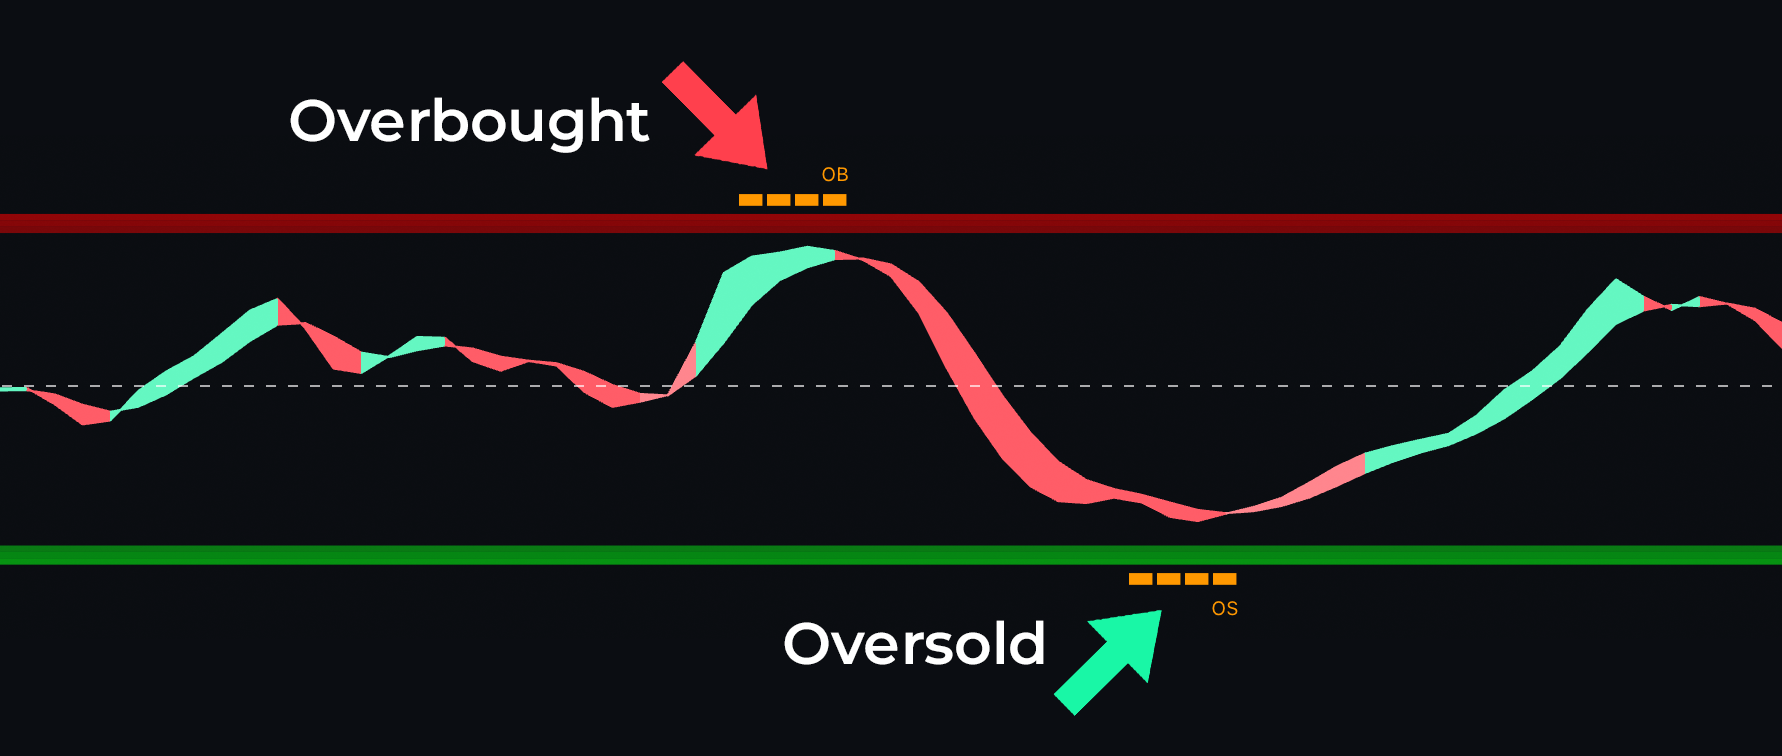
The Prime Oscillator clearly highlights overbought (OB) and oversold (OS) zones, where prices are more likely to reverse. These are displayed as orange OB or OS strips on the chart.
 |
|---|
| OBOS Signals showing overextended areas of the market |
When seeing an OS label, traders should avoid shorting or selling, as it suggests that sellers are exhausted, and buyers are likely to re-enter the market soon.
When an OB label appears, traders should avoid buying, as it indicates that buyers have exhausted themselves. This is often a good opportunity to take profits on long positions.
Just because a market is overbought or sold doesn't mean the market HAS to reverse. Buyers or sellers might continue coming into the market.
Automatic Divergences
The Prime Oscillator identifies two types of divergences:
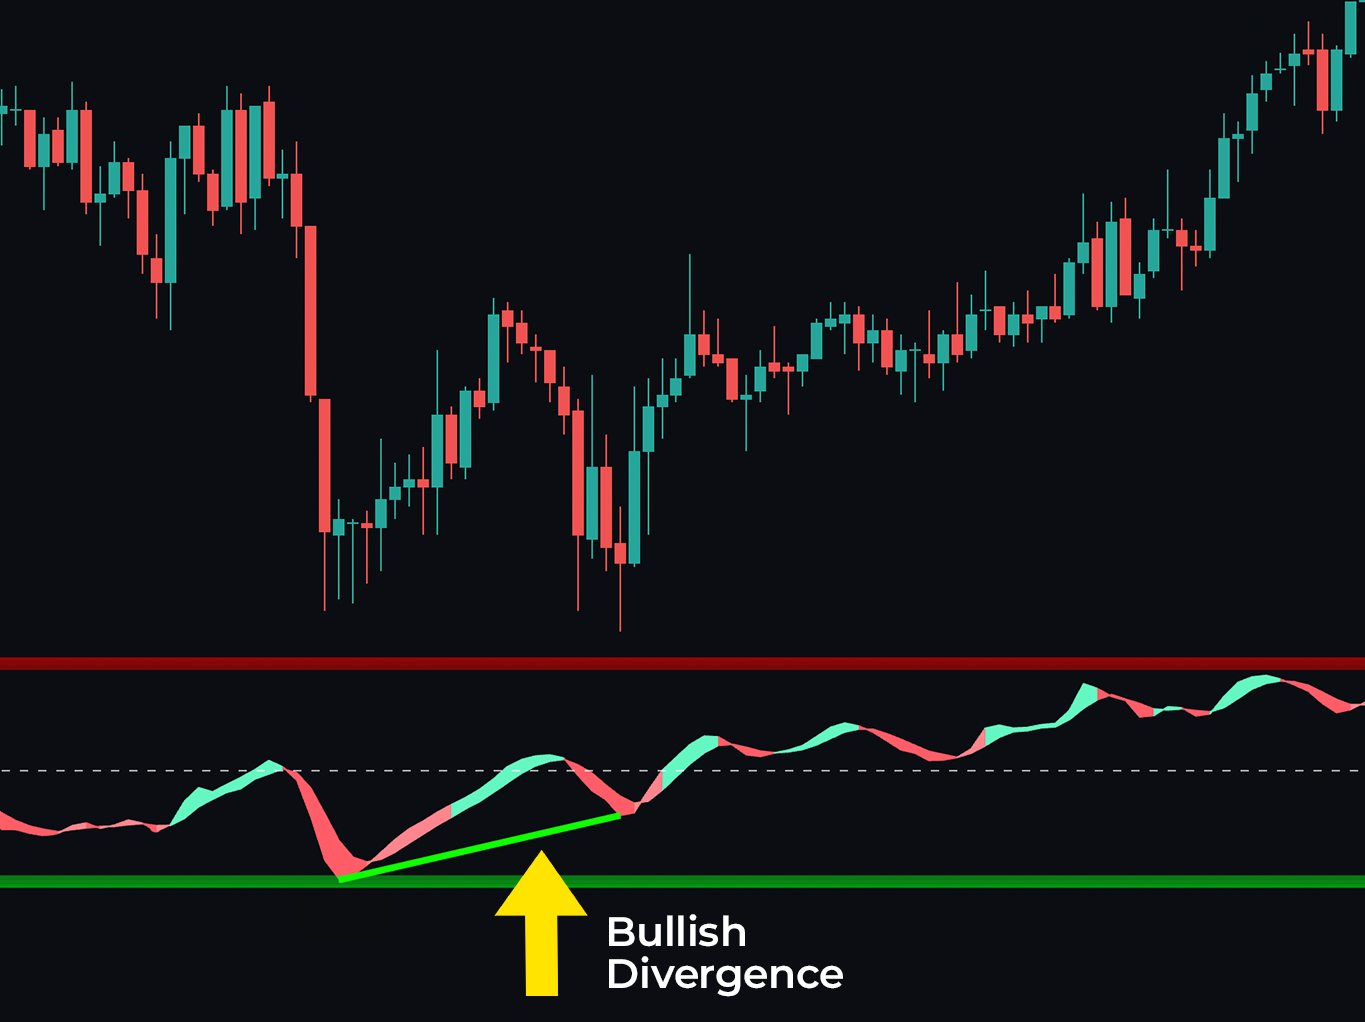
Regular Bullish Divergences: Occurs when price forms lower lows while the oscillator forms higher lows, signaling a weakening downward trend and the potential for an upward reversal. This suggests that bearish momentum is fading, even as prices continue to fall.
Regular Bearish Divergences: Happens when price creates higher highs, but the oscillator forms lower highs, signaling a loss of upward momentum and a possible reversal into a downtrend. Traders often see this as an opportunity to short or exit long positions.
 |
|---|
| Bullish Divergence shown on the Oscillator |
When a bullish divergence is identified, a green line connects the troughs of the oscillator, indicating a potential upward bounce. When a bearish divergence is detected, a red line connects the peaks, suggesting an impending pullback.
Bands
The band feature can be enabled in the settings, showing a band around the oscillator split into two parts. The green section represents the oscillator climbing, while the red section indicates it is falling. This adds another layer of confluence when reading the oscillator’s direction. Breaks in the band can also be enabled, which may highlight potential momentum breakouts for traders.