JBravo Kit
The Bravo Suite is an all-encompassing toolset designed by ChartPrime alongside JBravo, aimed at providing traders with various indicators and technical analysis tools.
The tools are designed to allow traders to analyze charts just like JBravo.
These tools prioritize ease of use, featuring simple inputs and intuitive visuals to assist users in making informed decisions.
This guide will provide an overview of the different features included in the Bravo Suite for JBravo and delve into some of the more intricate details.
Bravo 9 Count
The Bravo 9 Count system offers a unique take on the traditional 9 count. The major difference in the Bravo 9 Count is that it uses the trend angle instead of the generic method of counting candlesticks. By incorporating the trend angle, it can potentially provide better insights into the momentum behind the current price trend and identify trend exhaustion points more effectively.
The Bravo Suite calculates trend angles, giving traders a special advantage when counting 9 counts.
This approach allows the Bravo 9 Count system to consider not only the number of consecutive price increases or decreases but also the strength of these movements. Consequently, it can provide a more accurate depiction of the underlying trend, especially if the momentum of the price action is changing.
While the traditional 9 count system only counts the number of sequential candles based on consecutive higher or lower closes, the Bravo Sequential system uses the trend angle to identify whether the trend is losing strength. It displays a 9 count when it detects a possible trend exhaustion point, accompanied by an optional label for better visibility on the chart.
Candle Coloring
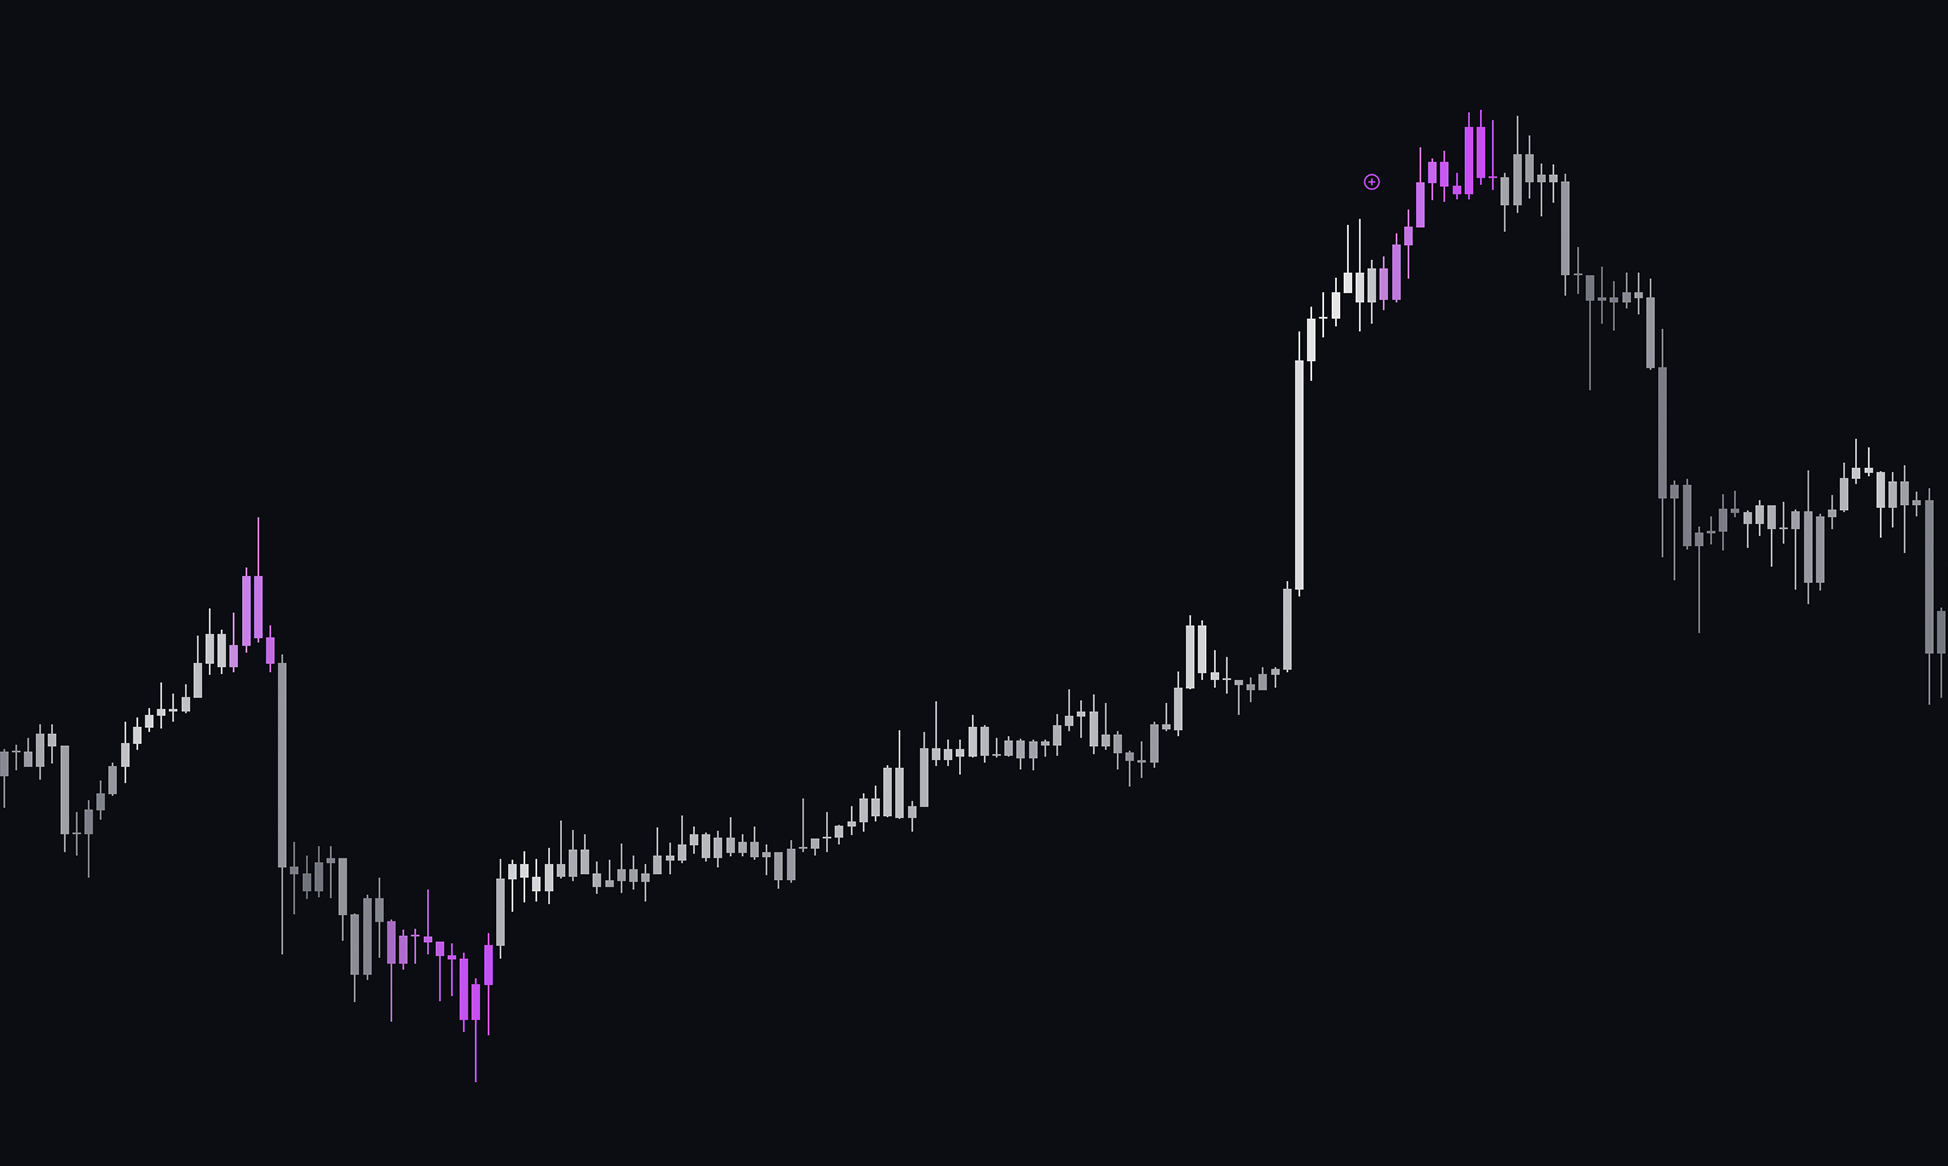
The candles provide a unique way of visualizing price action by color-coding them based on their angle relative to past prices. Users have the option to enable or disable the Bravo Candles theme.
When the candles are gray or white, the algorithm is not detecting any data that indicates a definitive trend change.
When trading reversals, it's great to look for signs of confluence e.g. by using an assistive oscillator.
When the Bravo 9 Count indicator has fired but a price reversal has not occurred, purple candles may appear. These purple candles, often referred to as the “Purple Nurple,” indicate that the reversal is extended, and a change in price direction could be imminent. As always, risk management should be part of your strategies; however, in theory, the trigger is ready to be pulled on trades. It is strongly encouraged that traders confirm confluence with other indicators, such as the MVP Oscillator or the Oscillator Pro.
 |
|---|
| The Bravo Count |
Bravo Bands
The Bravo Fibonacci Bands, also referred to as the “Bravo Bands,” are an advanced and innovative feature of the Bravo Suite, specifically designed to offer a more precise and dynamic price channel using a custom blend of Fibonacci numbers and weighted averages.
 |
|---|
| The Bravo Bands |
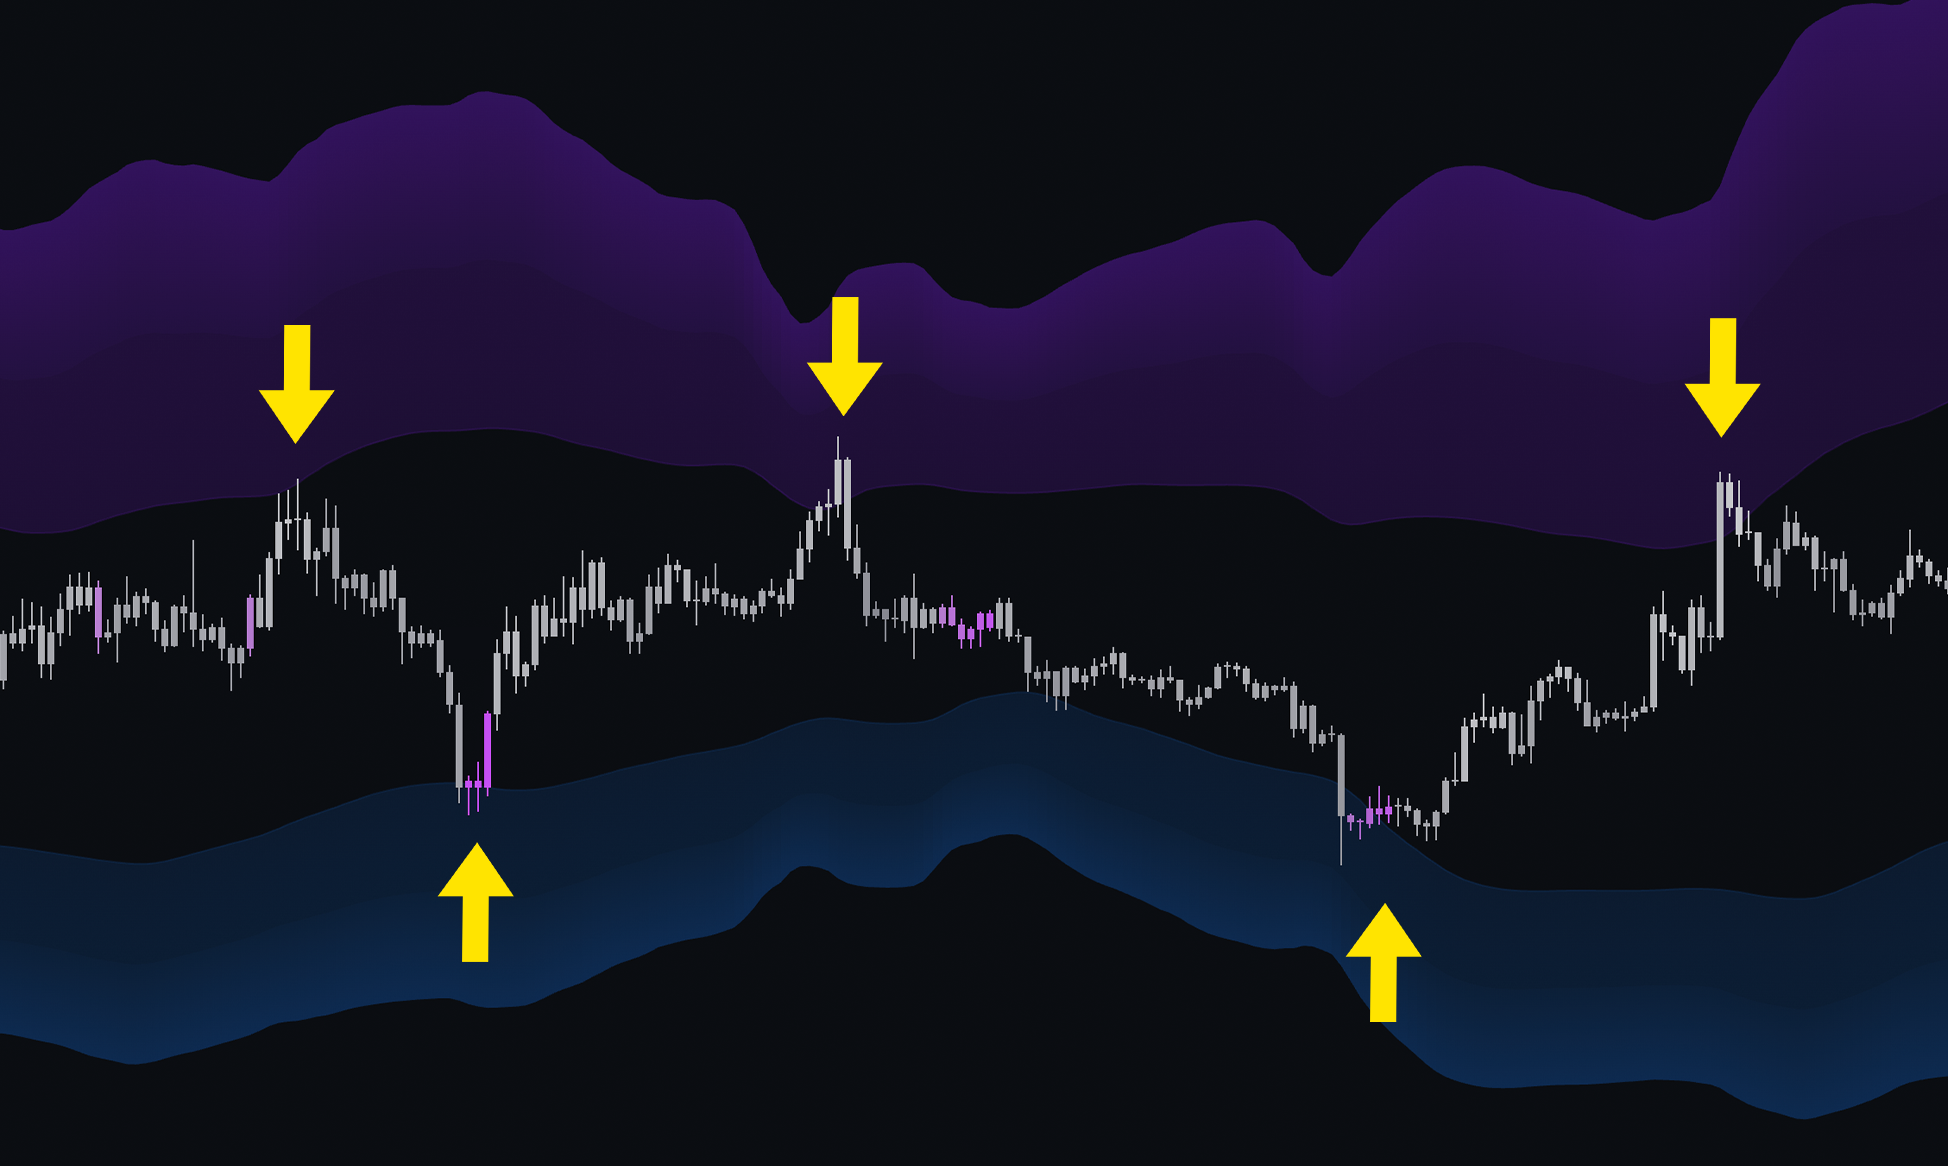
Displayed as a purple cloud above and a blue cloud below the candle area, these bands provide a dynamic price channel for price action. When price enters these clouds, a reversal in trend is often observed. These bands work well in conjunction with the Bravo 9 Count indicator for trade confirmations.
When price reaches the top cloud, a downward reversal might be incoming. When price reaches the bottom cloud, a bounce upwards might be expected.
The end result is a reliable, easy-to-read price channel that gives traders the confidence to make informed decisions.
Bravo MAs
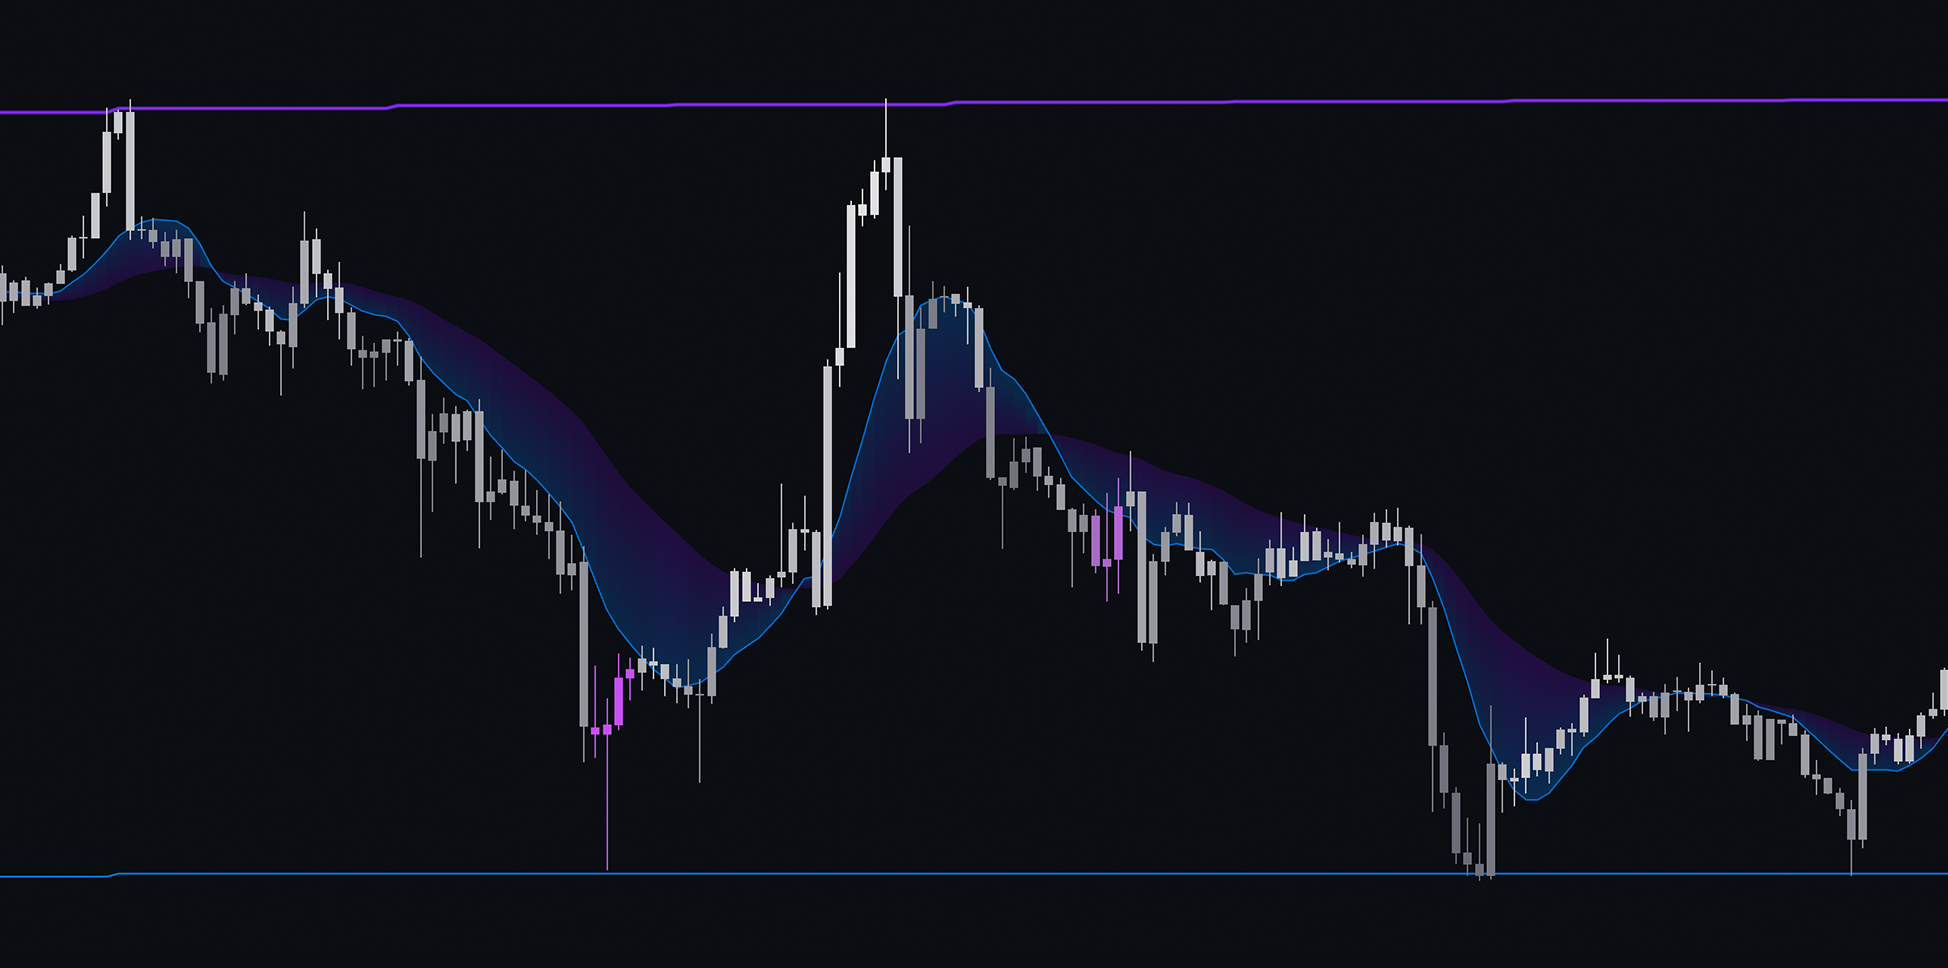
The Bravo 9 Moving Average is included in the suite and has been turned into a trend-following ribbon.
The kit also provides other useful moving averages used by JBravo for various timeframes, such as the 200-day Moving Average and the 100-week Moving Average. Traders can toggle the visibility of each moving average. These are custom-designed lower lag moving averages, intended as assistive and supporting features in the toolkit.
 |
|---|
| The Bravo MAs |
Moving averages in trading can serve both support/resistance purposes as well as trend-assistive capabilities. Price often reacts off these zones in the market. Additionally, when the price is above the moving averages, it implies an uptrend; when it’s below, a downtrend. The 200-day moving average is relatively more short-term than the 100-week moving average, as it considers significantly more data.
Bravo Screener [For Pro]
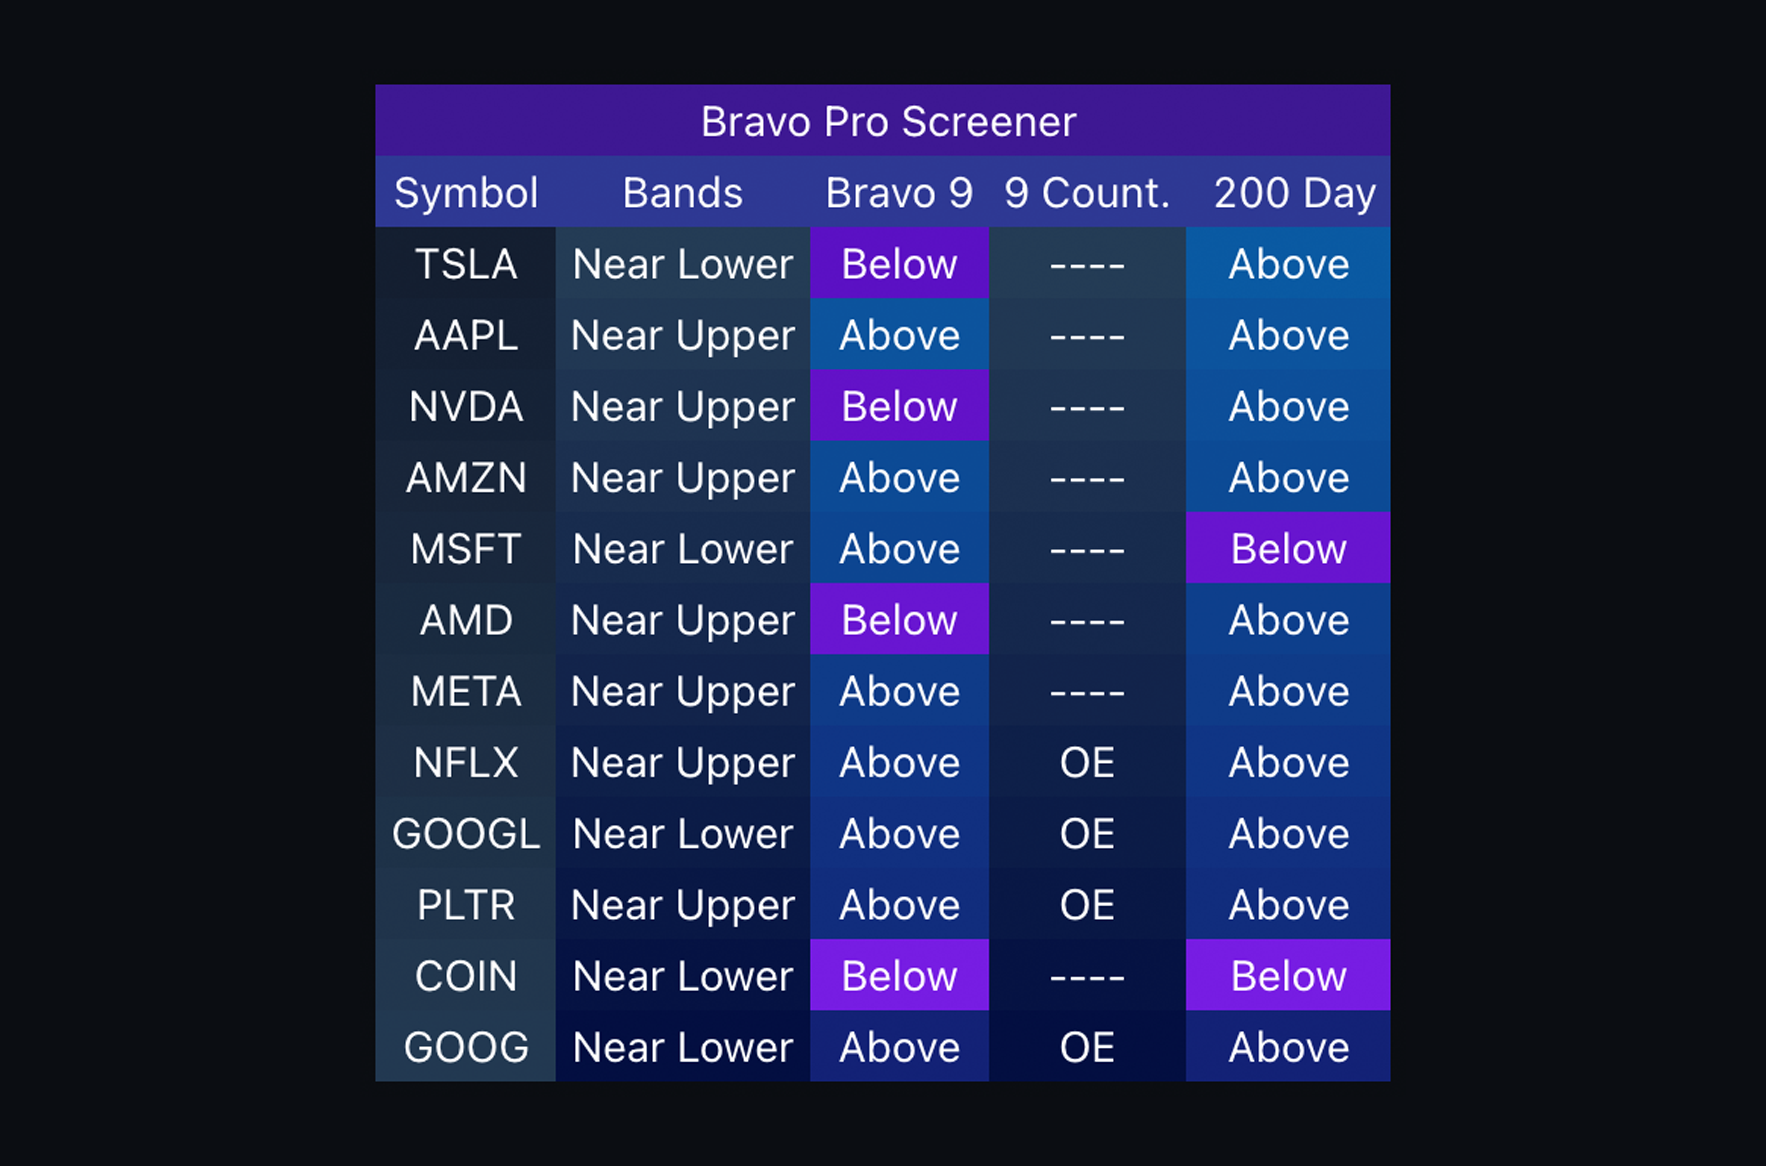
The Bravo Pro Screener provides instant access to a trader’s custom watch lists. You can screen for 9 counts, above or below the Bravo 9, above or below the 200-day moving average, and a reading from the Bravo Bands.
 |
|---|
| Bravo Pro Screener |
By having this information readily visible, traders can let the screener do the chart watching. The list of assets being screened can be adjusted via the settings.
For a full overview of the Bravo kit: