SR & Trendlines
Pivot Points Levels
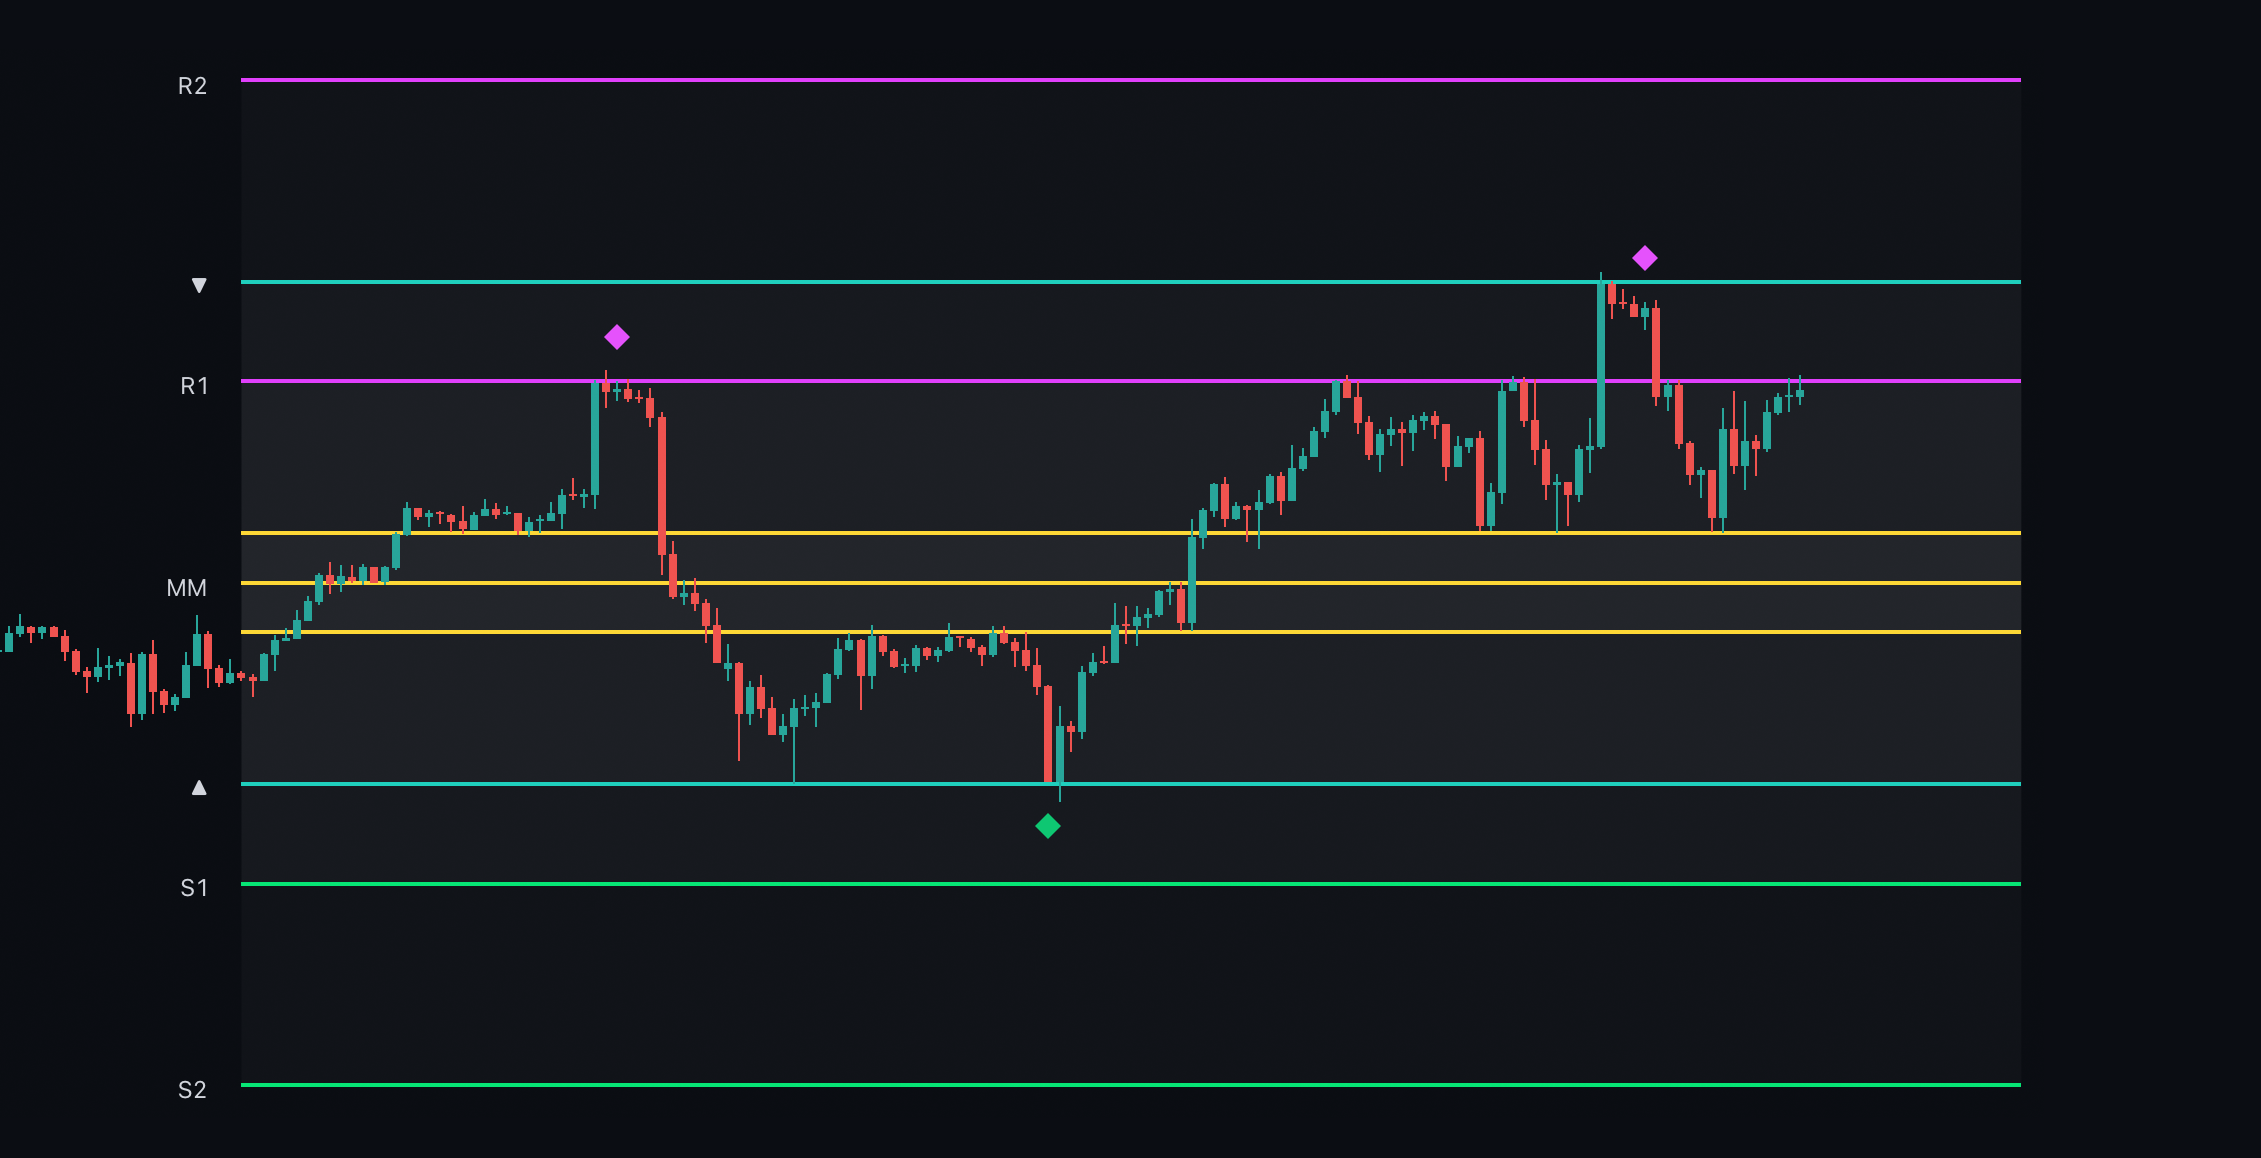
The Pivot Points level feature is designed to give traders actionable levels inspired by pivots to trade from. It calculates pivot levels (Support and Resistance) based on higher timeframe price periods. These levels are:
- S1/R1: First support and resistance levels.
- S2/R2: Second support and resistance levels.
- S3/R3: Third support and resistance levels (optional).
- MM (Midline): The midpoint of the range, with two yellow deviation lines for additional context.
Labels on the left indicate the type of level (S or R), along with optional details such as the timeframe, price level, and name. The midline (MM) and its deviations are plotted in yellow to provide additional analysis of price trends and previous period pivot levels are marked with triangles, acting as significant historical reference points.
 |
|---|
| Prime Pivots in action |
Signals are also provided with this feature:
- Buy Signals: Triggered at Support (S) levels when the market is oversold and retest these levels.
- Sell Signals: Triggered at Resistance (R) levels when the market is overbought and retest these levels.
- Signals are displayed as diamonds, ensuring they are aligned with the most critical levels.
The option to show previous periods’ pivot levels provides additional context and aids in identifying market trends over time.
Pivot Points from Higher Timeframes (HTFs)
The indicator additionally allows users to plot pivot points from up to 4 higher timeframes directly onto the current chart. These higher timeframe pivots act as significant support and resistance zones.
- Each pivot is labeled with:
- The selected timeframe.
- Whether it represents a high or low pivot.
- The corresponding price level.
Users can customize the number of pivot levels displayed and choose different timeframes for analysis. This feature allows traders to align their strategies with higher timeframe trends and zones.
To learn how to maximize the use of ChartPrime's Pivot Points Levels, watch the tutorial below:
Trendlines
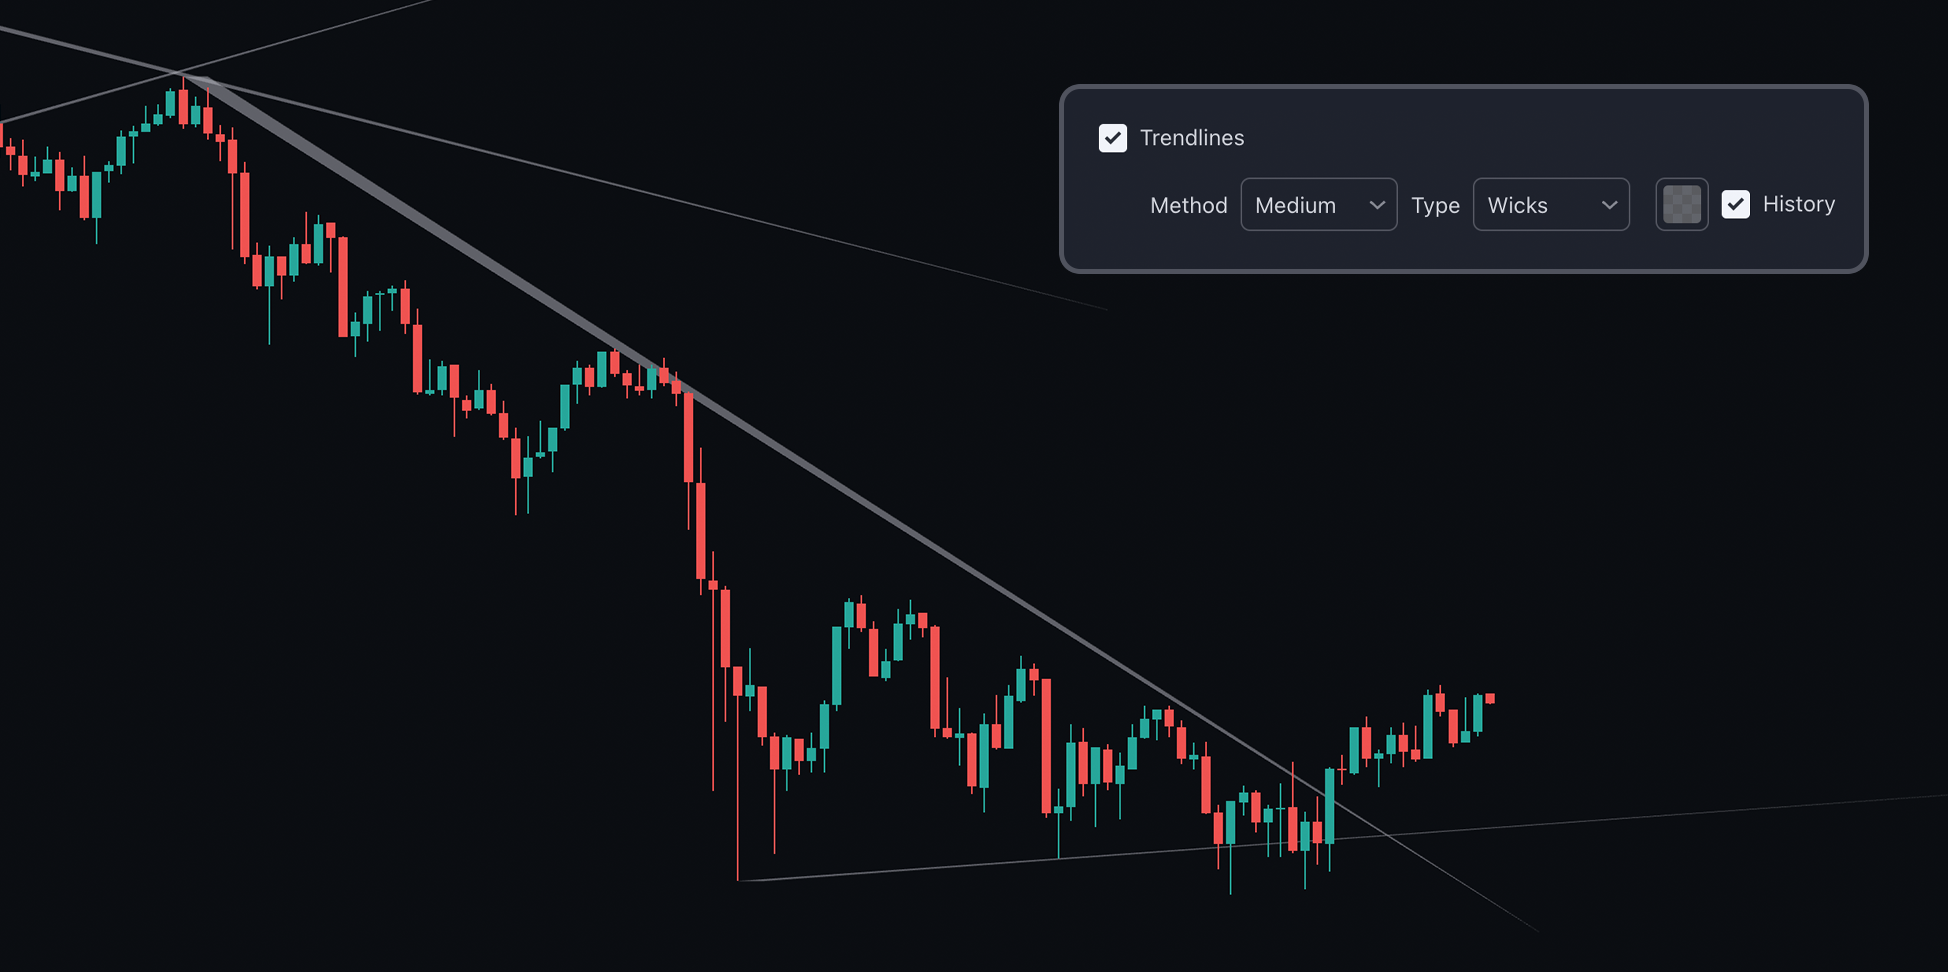
Trendlines in ChartPrime's Market Dynamics are designed to be cleaner and more actionable. Traditional trendline indicators tend to be one-dimensional. When creating trendlines, there are two primary approaches: drawing from the body close or from the wicks. In the settings, users can choose their preferred method for drawing trendlines. Additionally, traders can adjust the scale of the trendlines. For example, a trader seeking a longer, more significant trendline may opt for the "big" or "macro" setting, while someone desiring shorter, more actionable trendlines might select "small" or "medium."
The history toggle allows users to display historical trendlines. By default, only the most current trendline is shown, but this can be toggled on. Users can also customize the color of these trendlines through the provided input options.
 |
|---|
| Trendlines showing historical performance |
Trendlines conclude at a point, indicating that they are no longer relevant and that the price action no longer respects this area. Traders should focus on future trendlines for their trading strategies.
To learn how to maximize the use of ChartPrime's trendlines, watch the tutorial below:
Predictive Ranges
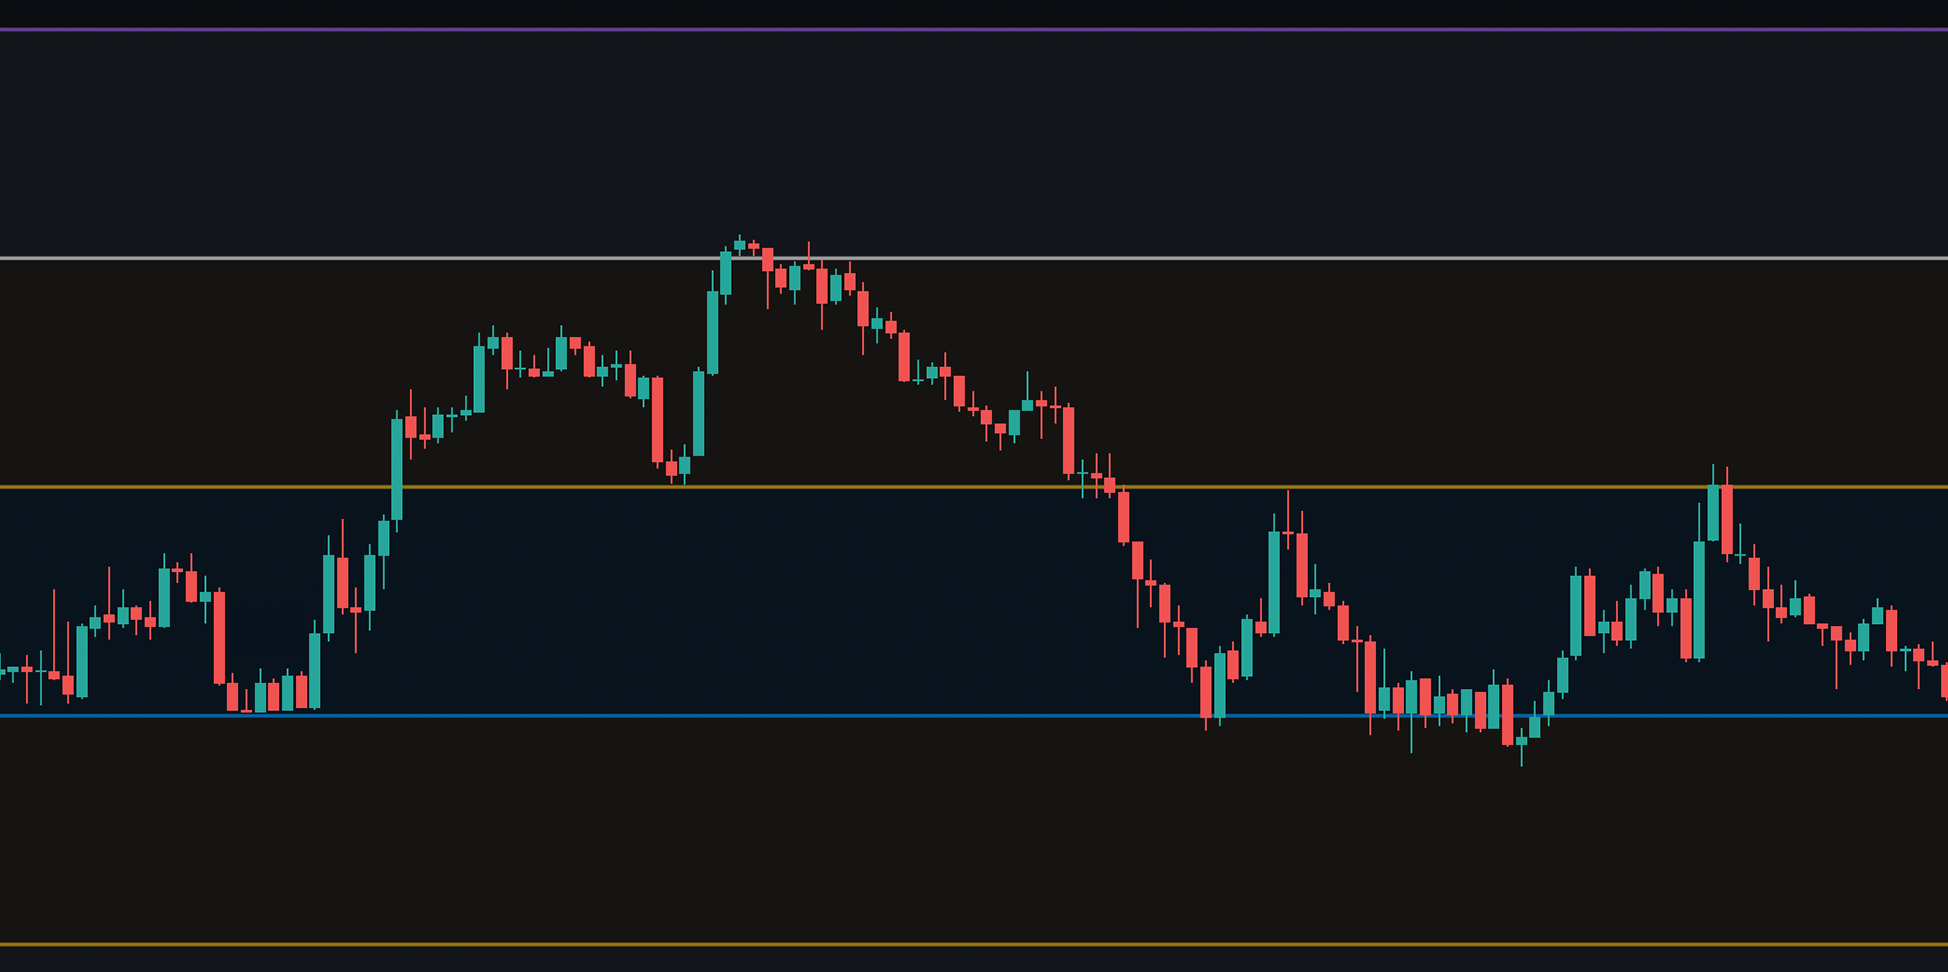
Predictive Ranges provide real-time price action ranges on the user's chart, where price may find support and resistance levels during trading. Traders can adjust the length used for detecting the range; the default is 50 bars of analysis. Users who want more frequent ranges can reduce this to 10-20 bars.
 |
|---|
| Real-time chart range displaying live support and resistance levels |
Below is a complete tutorial on how to use the Predictive Ranges:
MTF SR (Multi-Timeframe Support and Resistance)
The MTF SR feature allows classic support and resistance levels to be displayed from various timeframes. Once enabled, traders can select the desired timeframe. We recommend using a timeframe at least four times higher than the current timeframe to ensure sufficient data variation. For example, if the user is on a 30-minute chart, using a 2-hour MTF SR is advised. Analyzing SR levels on higher timeframes can provide insights into potential future price action on lower timeframes.
Users can customize the color and style of the SR levels, choosing between lines or zones. Zones accommodate some degree of error, while lines offer greater precision.
Traders can select how macro or micro these SR levels are using the provided dropdown menu, with options including:
Local
Midterm
Extended
Macro
Local mode identifies shorter-term SR levels, while Macro selects longer-term levels. It’s generally advisable to experiment with these settings to find the style that best suits the user's trading approach.
Users can also toggle on data metrics, which provide basic insights. The first value indicates the relative significance of the SR level (e.g., 1 for the most significant level and 5 for the fifth most significant). The second value shows the price at which the SR is generated, and the final value indicates the timeframe from which the SR is derived.
Highs and Lows MTF
Via the settings traders are able to see swing points from different timeframes.
Day Week Month Quarter Year
These can be used as SR zones and also show key reversion points in the market.