The Structure
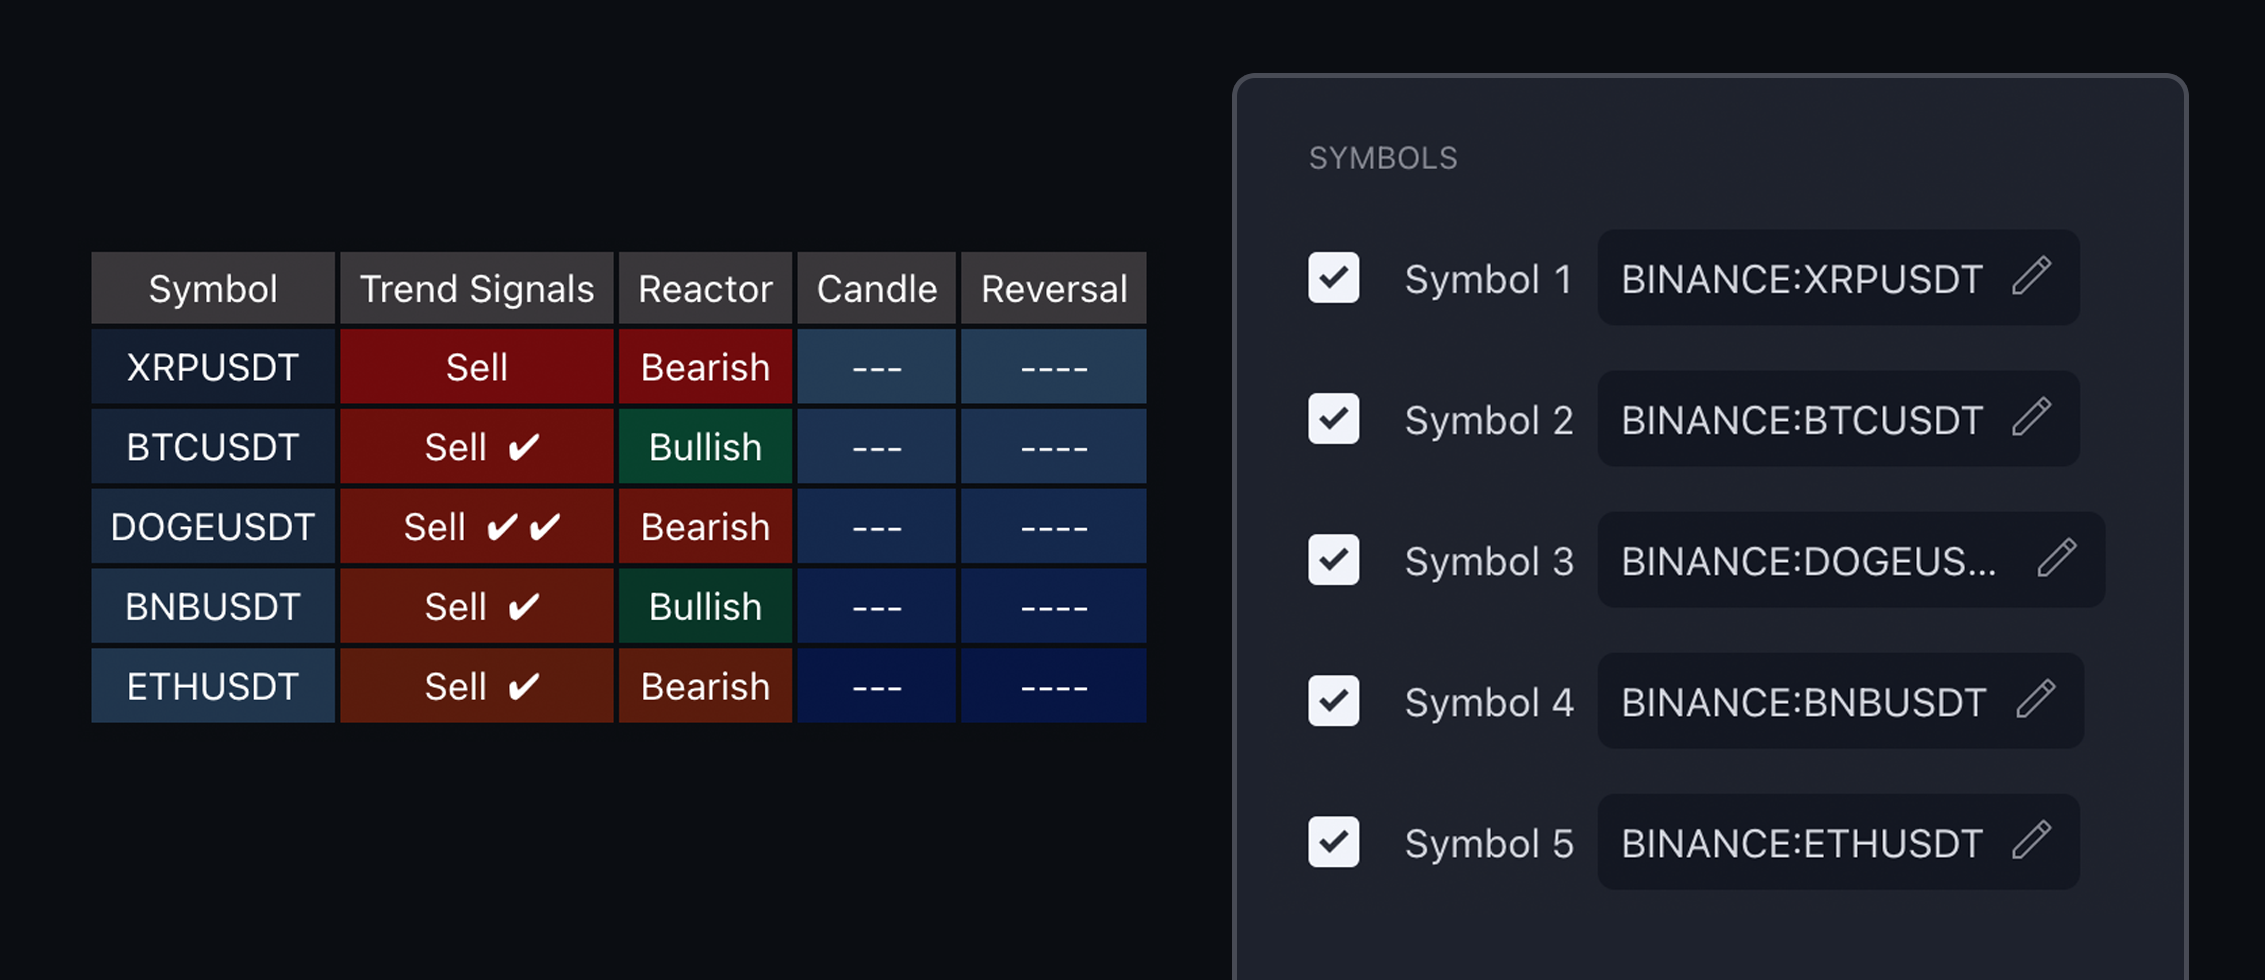
On the leftmost side of the screener, users can see a customizable list of tickers in the settings menu. Traders can select from 20 assets, and the screener supports all assets built into the TradingView platform.
 |
|---|
| Prime Screener turned on by default |
Each row in the screener table scans across all selected assets on the timeframe currently chosen by the user. For example, if the user is on the 15m chart, the screener will analyze all the 15m charts for the selected assets.
Signals
The Trend Signals column utilizes ChartPrime’s premium Trend Signals found in Market Oracle. This column displays the current signal based on the tuning set within the settings.
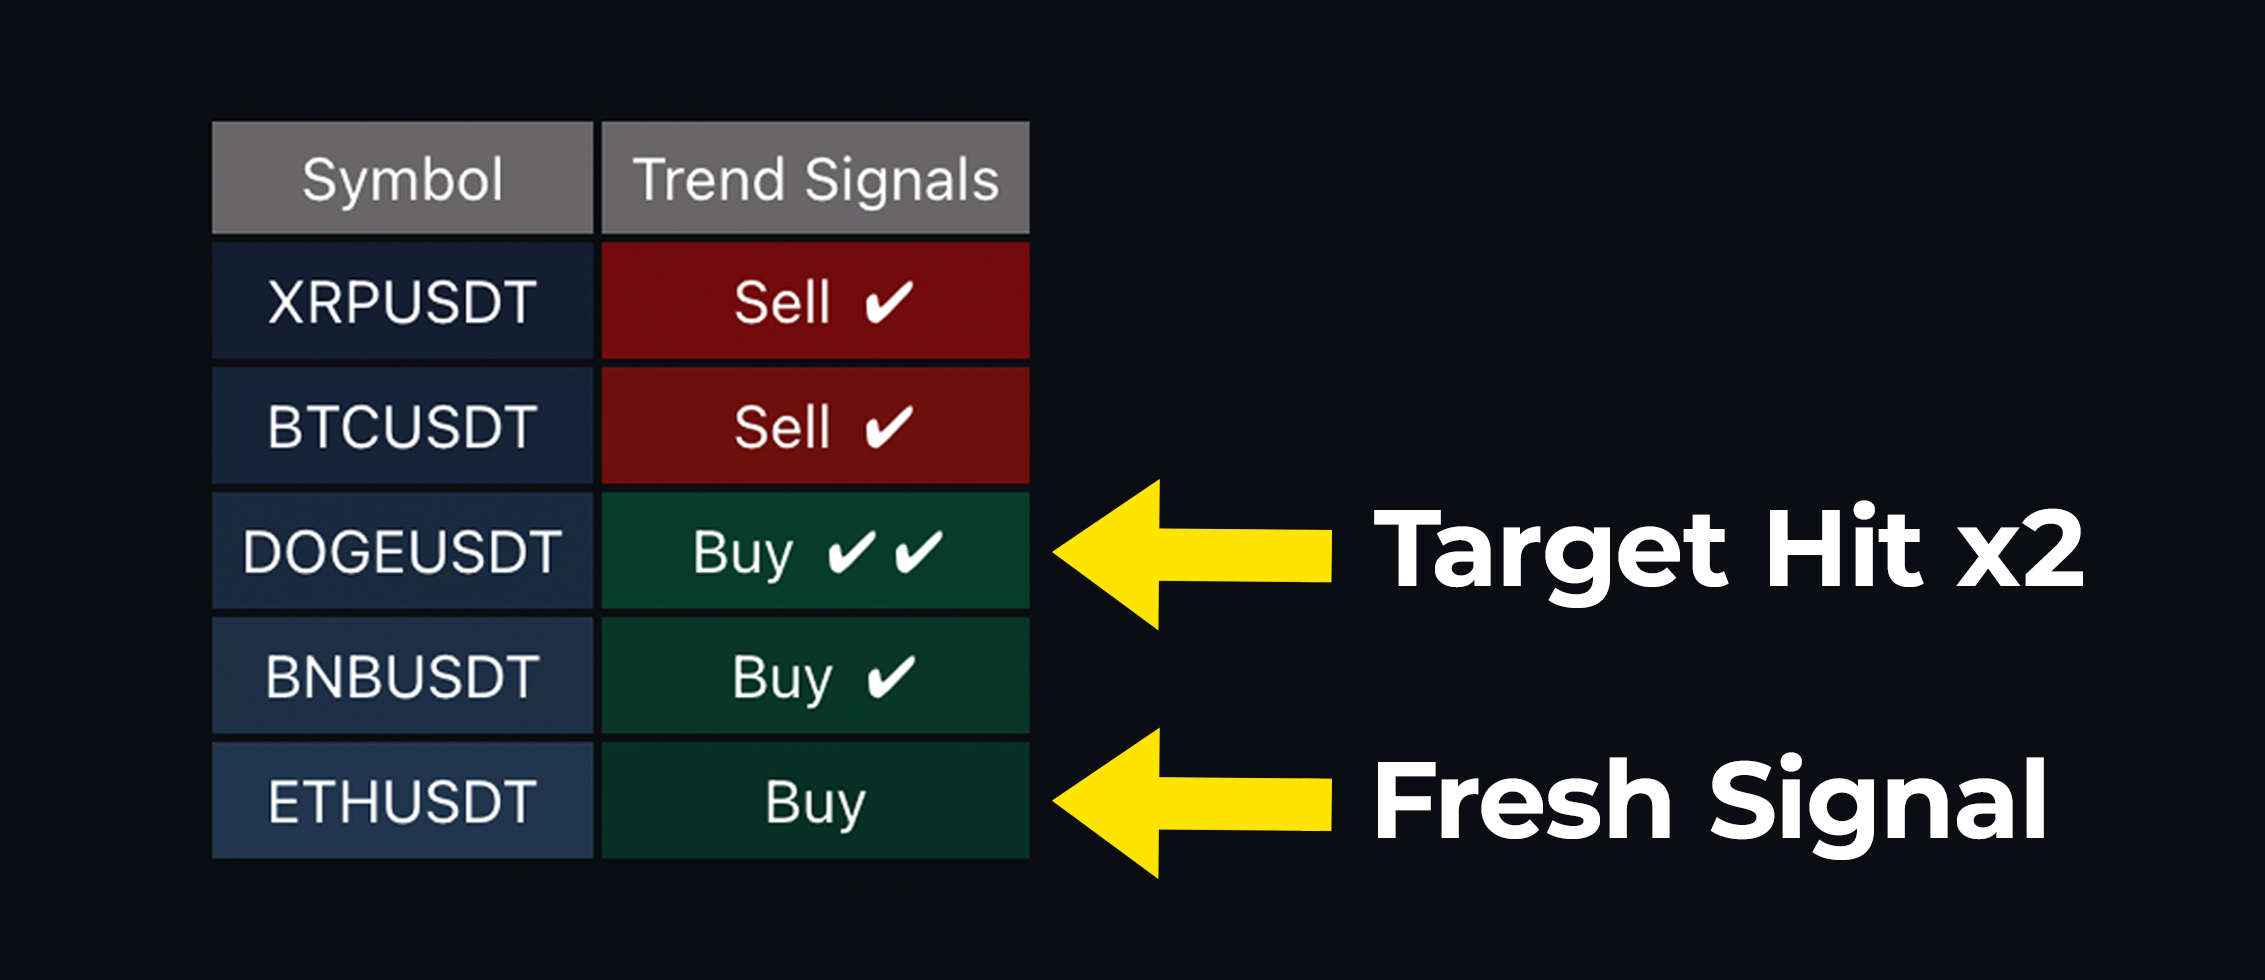
If there is a sell signal, the box will be red with a “Sell” label. Conversely, if there is a buy signal, the box will be green with a “Buy” label. Users will also notice ticks appearing next to these labels. For instance, a Buy signal with two ticks indicates that two take profits have been hit by the price action.
 |
|---|
| Target Profits displayed |
Two take profits being hit may suggest that the signal has "expired," meaning the best part of the trade has already played out. A single tick could indicate a similar situation.
Looking for signals with no ticks can present the most opportunity, as the signal hasn’t fully played out yet.
Reactor
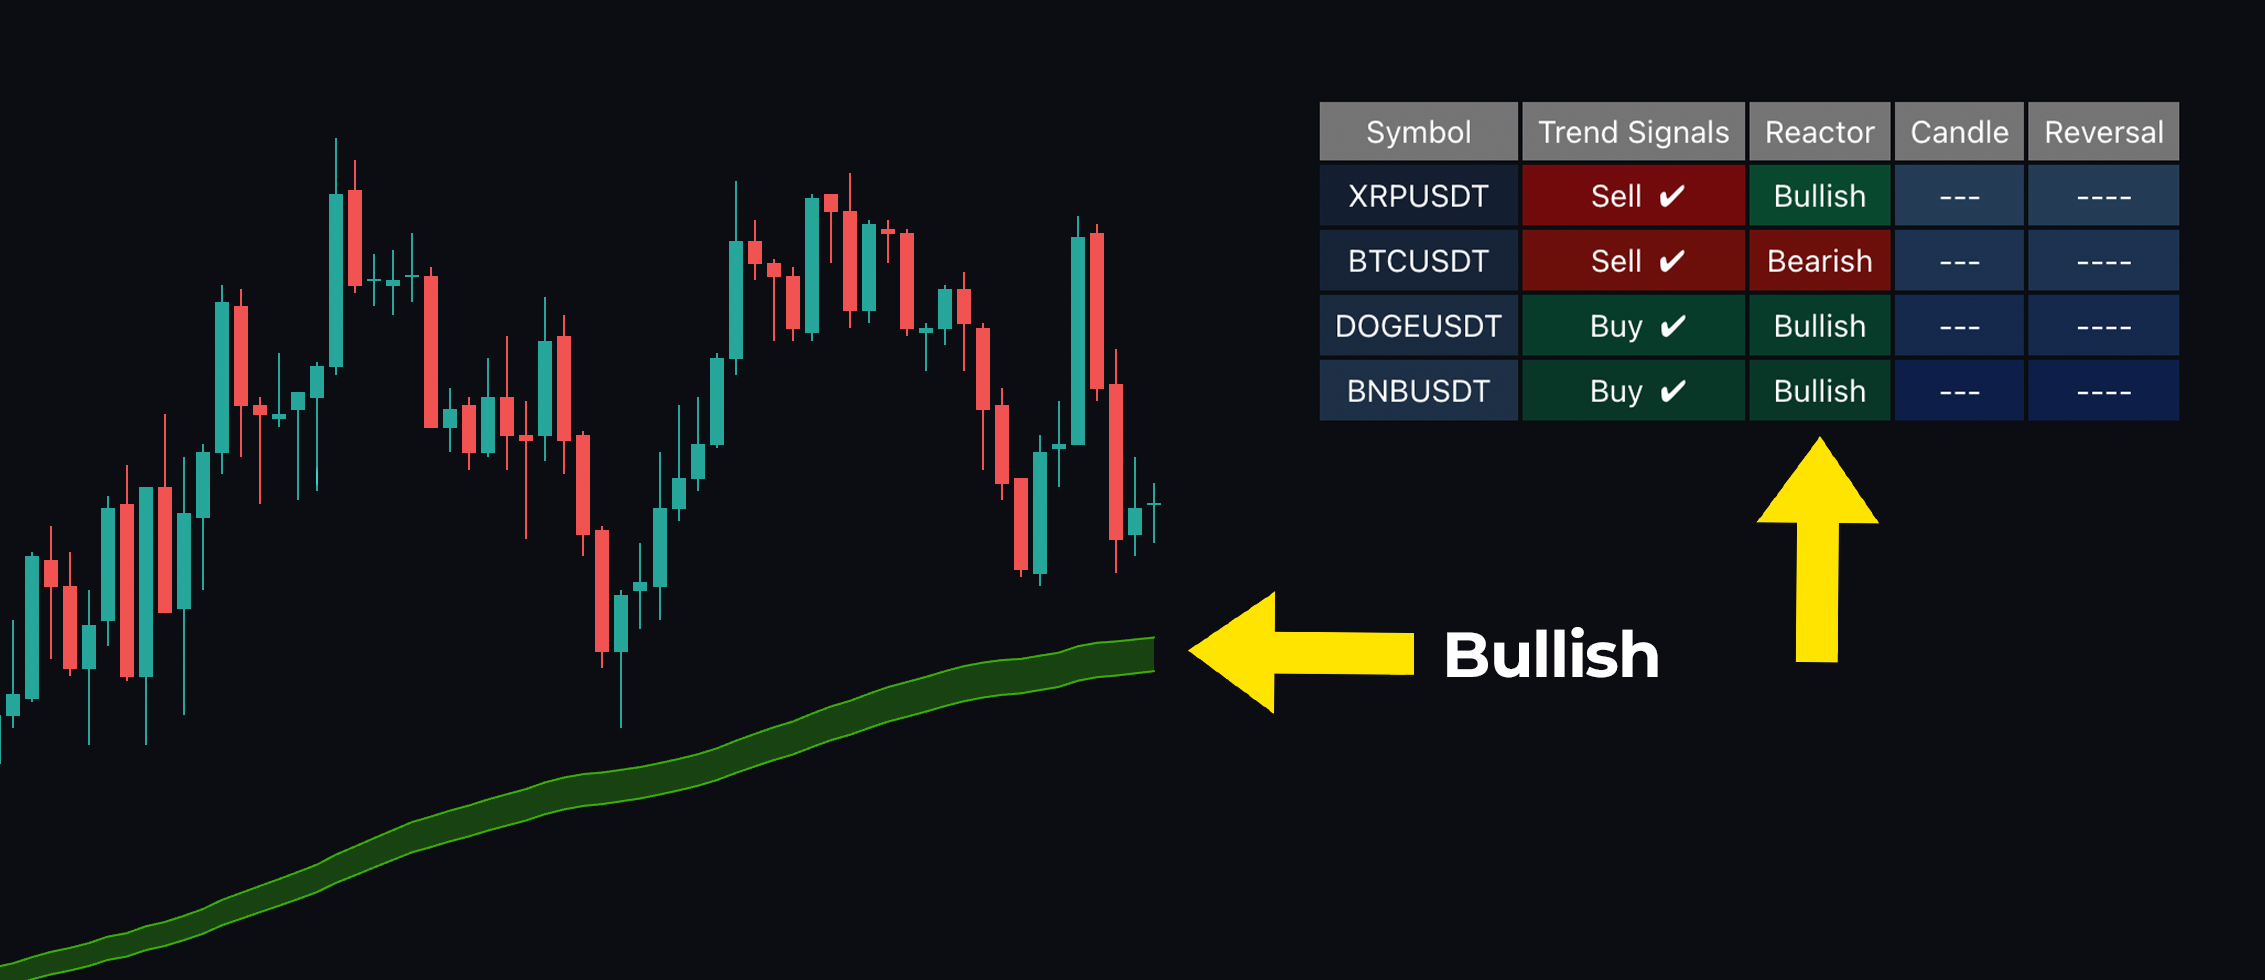
The next column is the Reactor column, which pulls data from the reactor found within Market Oracle. If the reactor is red, the screener and cell will display “Bearish,” while a green reactor will show “Bullish.” Generally, this column serves better for confluence purposes than for actionable signals.
 |
|---|
| The Reactor being reflected in the Screener |
Searching for opportunities, such as a Sell signal with no ticks alongside a bearish reactor, provides confluence and confirms a market downtrend, creating an entry opportunity for a trade.